
Theory-Data Maps & Inter-Theory Relationships
Comparing causal theories and their empirical evidence, computationally
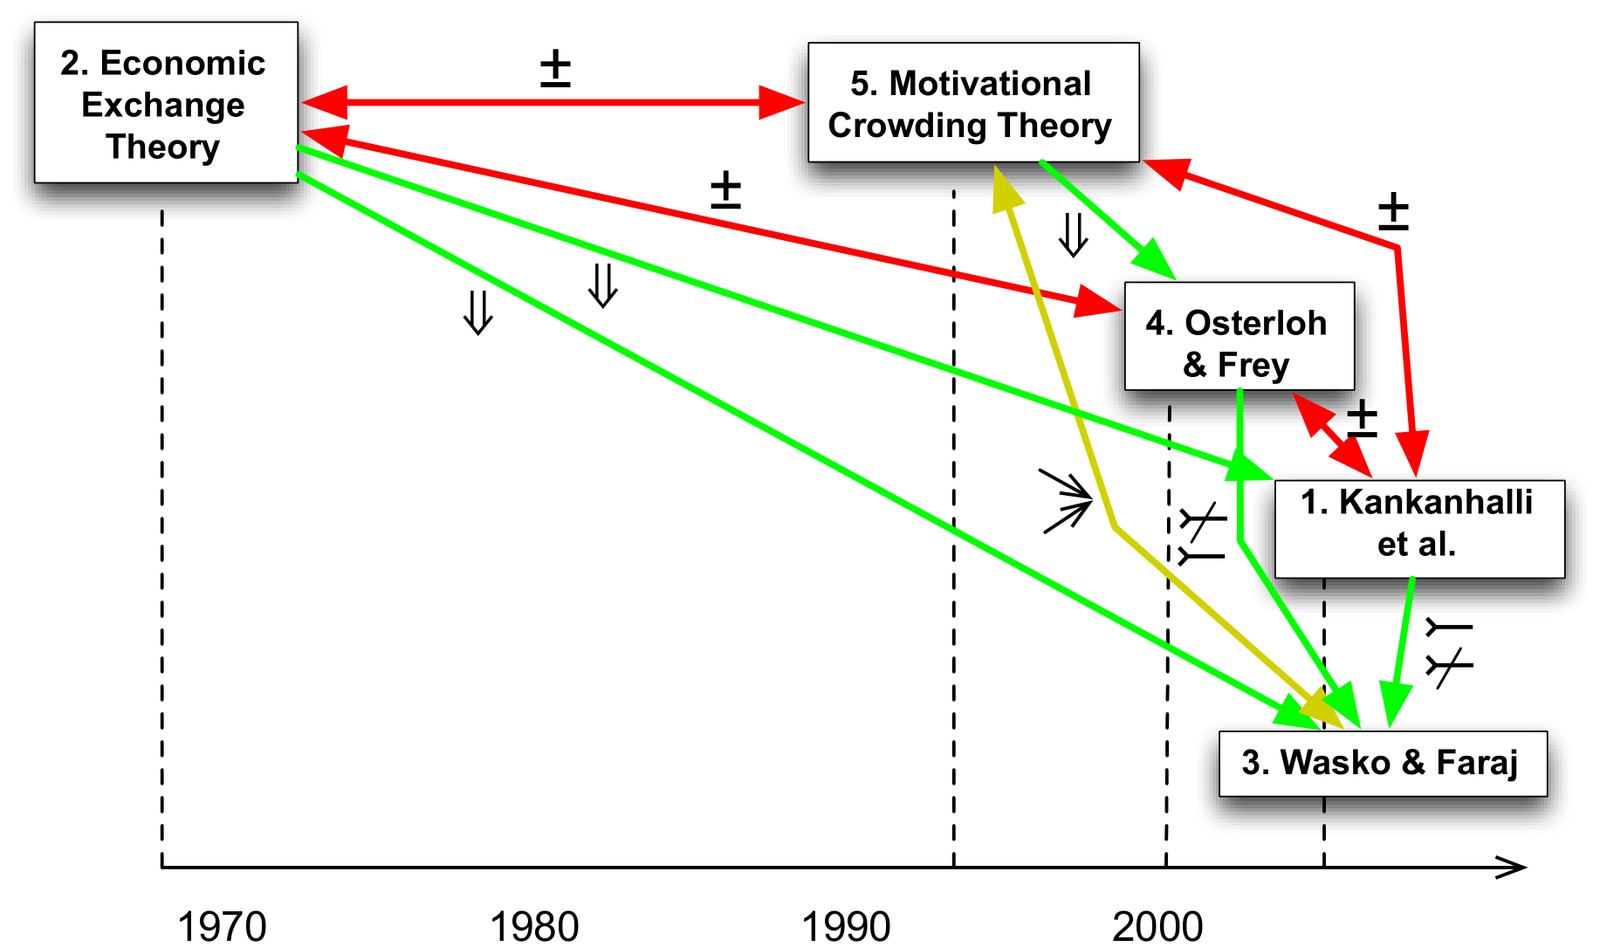
Literature reviews should not just retell paper after paper. They should show how theories relate to each other and to the evidence. In practice, this is done by hand in concept matrices, and with dozens of theories it quickly becomes unmanageable. As Weber put it, the IS discipline suffers from a “clutter” of partially articulated, partially tested theories.
In two HICSS papers I proposed a way to compare causal theories, and their empirical tests, computationally. Both rest on a meta-model in UML with two parts: a theory space that describes causal theories, and a data space that describes empirical findings.
Inter-theory relationships
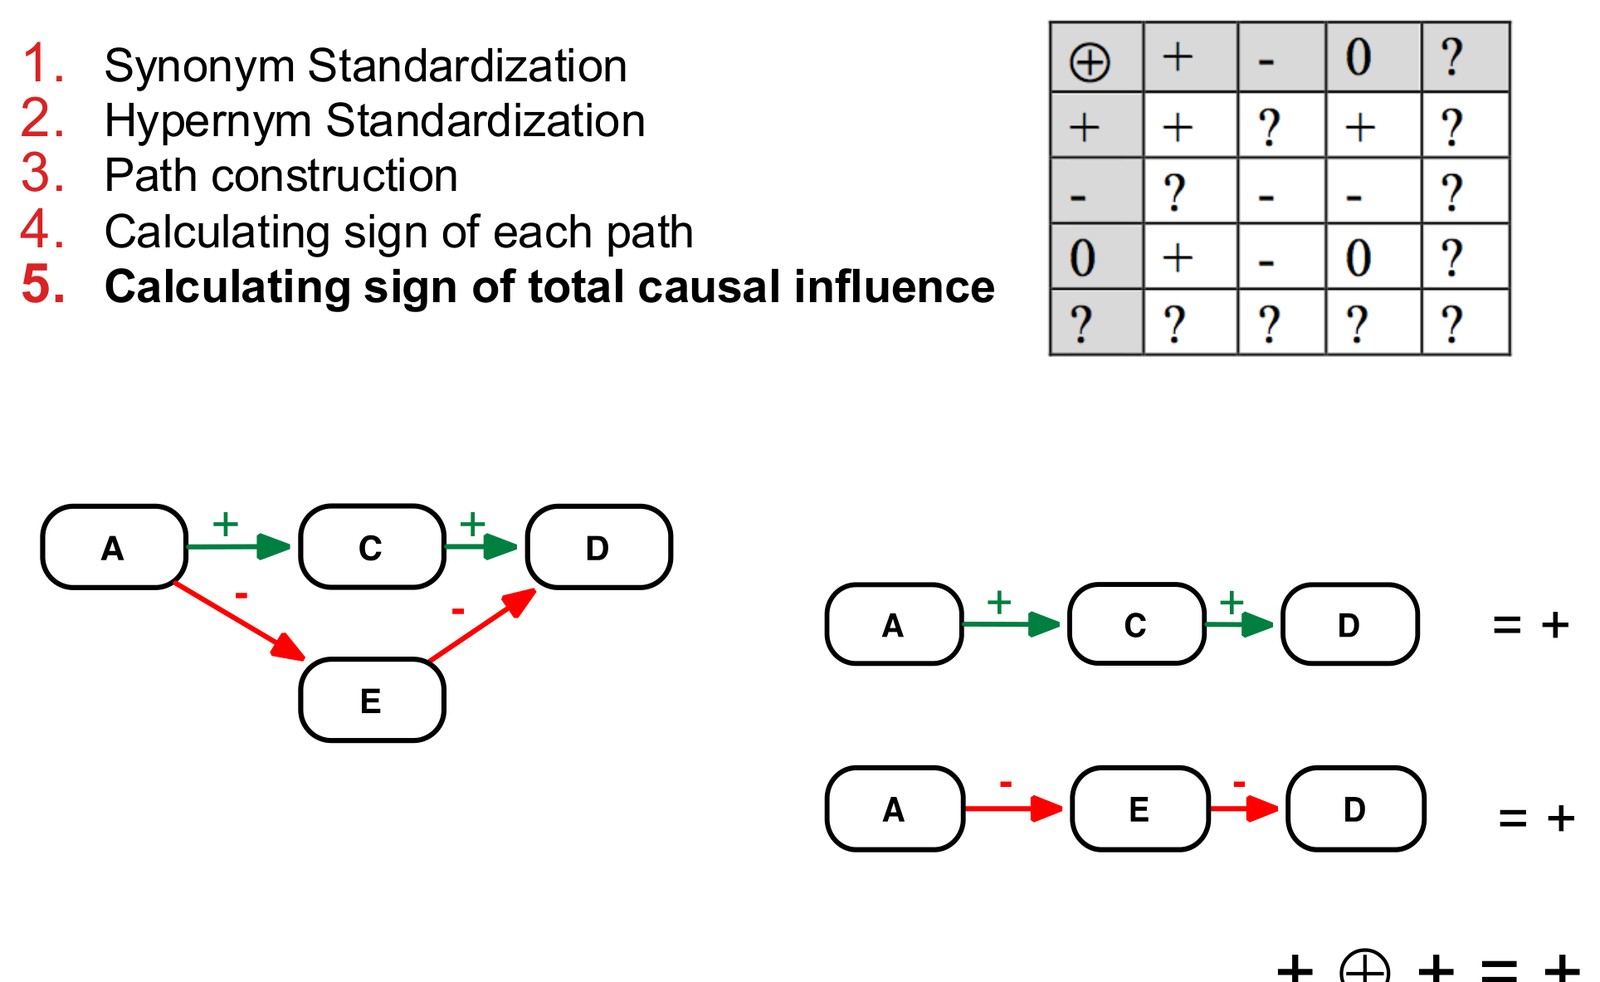
The meta-model represents a causal theory as constructs connected by causal propositions with a sign (+ or −), plus synonym and hypernym relationships between constructs and interaction effects. Once two theories are described this way, the total causal influence of one construct on another can be calculated: standardise synonyms and hypernyms, construct all causal paths, and combine the signs along and across paths.
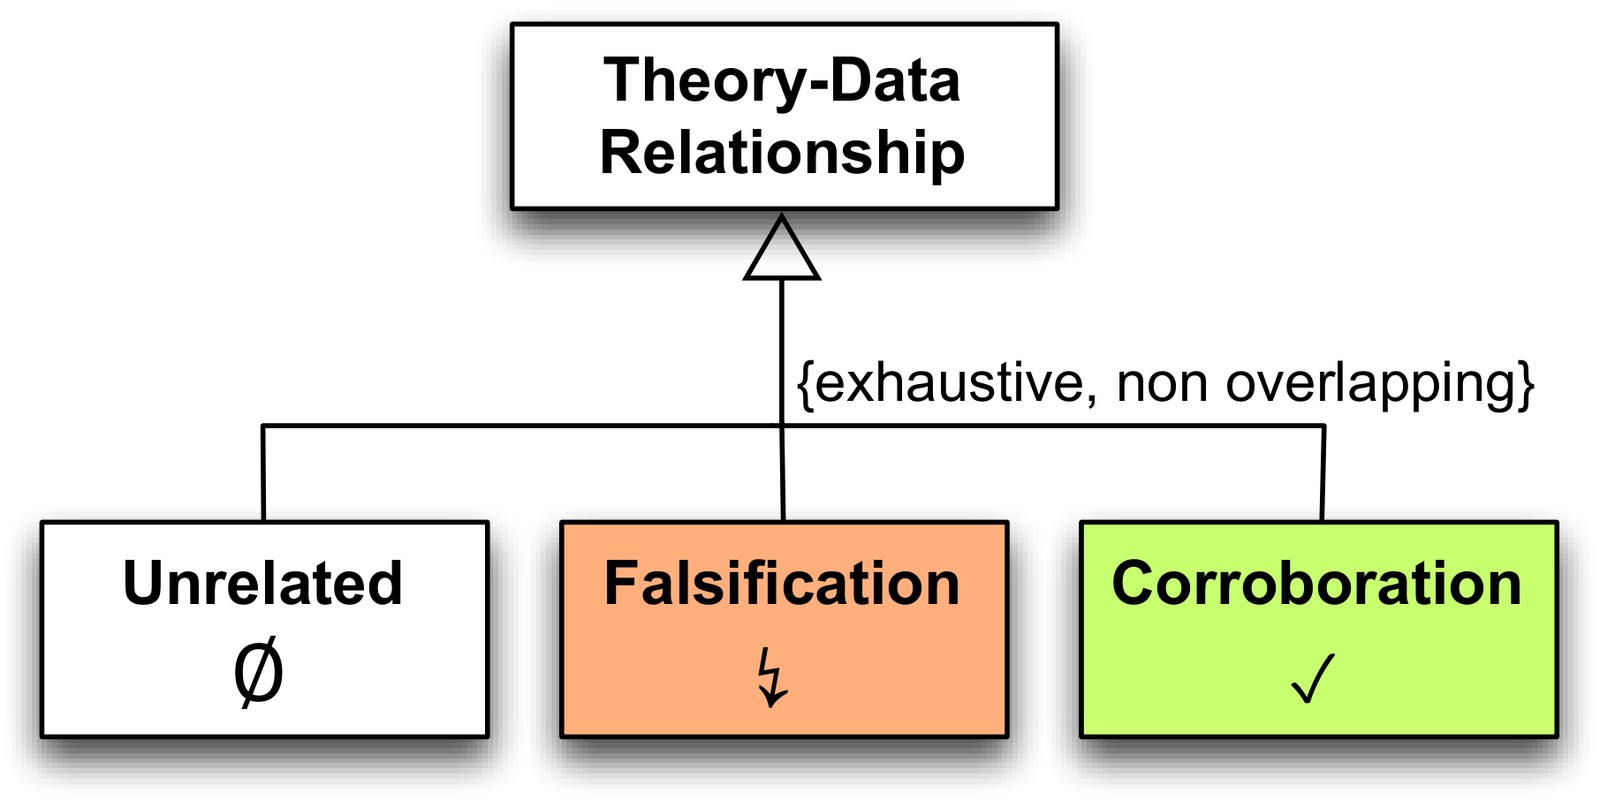
From this, the relationship between any two theories can be inferred automatically. The taxonomy is exhaustive and non-overlapping:
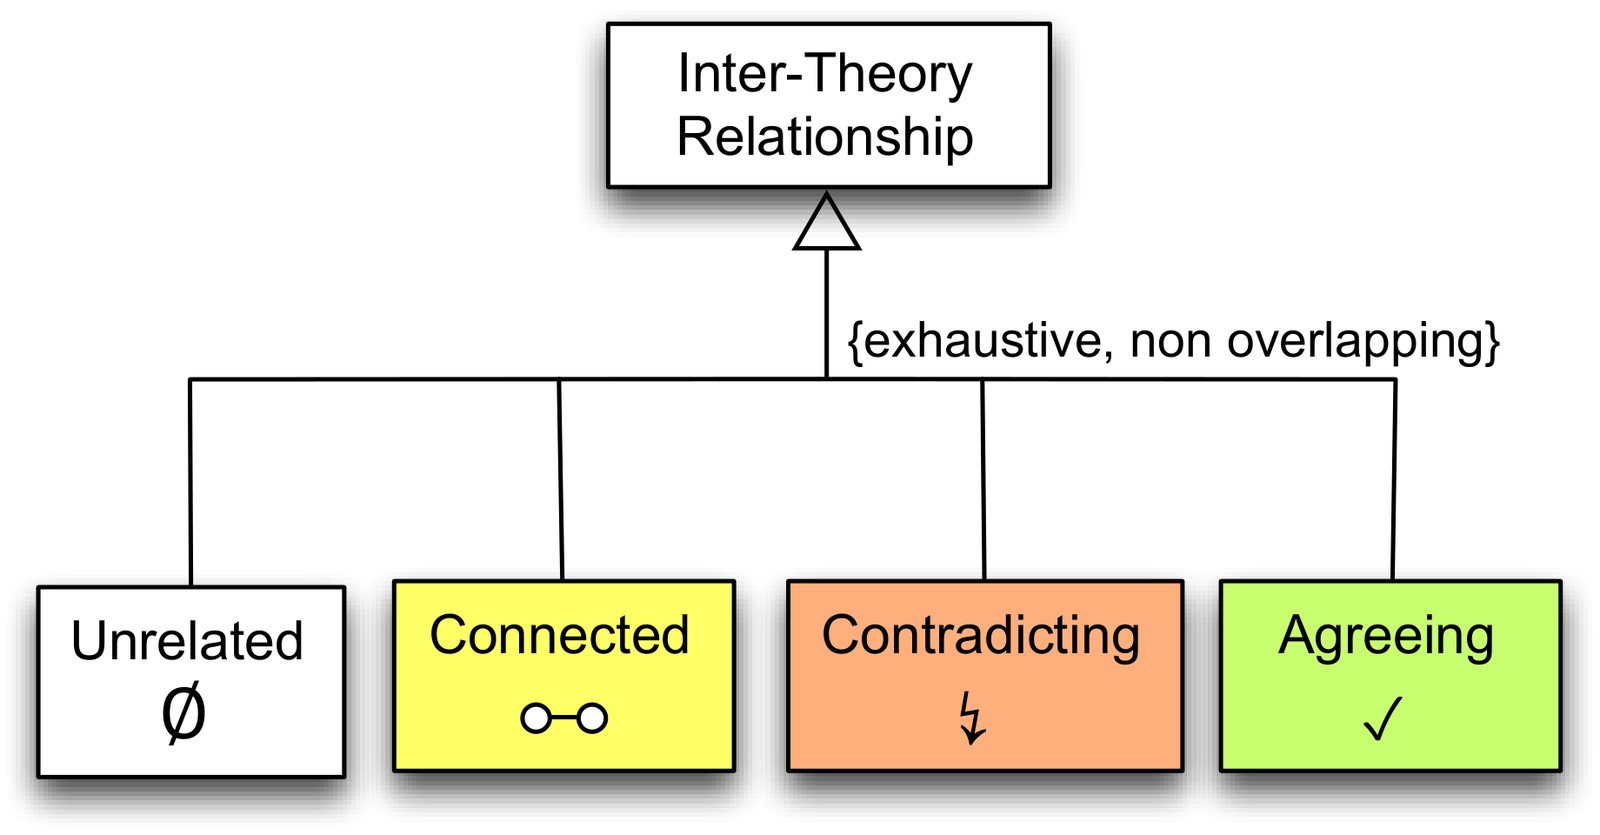
- Unrelated: the theories share no constructs.
- Connected: one theory explains the independent variable of the other, or offers an alternative cause for the same effect.
- Contradicting: a different effect sign, a missing causal effect, a common cause, or a different causal direction.
- Agreeing: identical, superset, an additional effect or cause, an alternative working mechanism, or one theory explaining the working mechanism of the other (through a cause-effect chain or as a more specific theory).
Two new visualisations
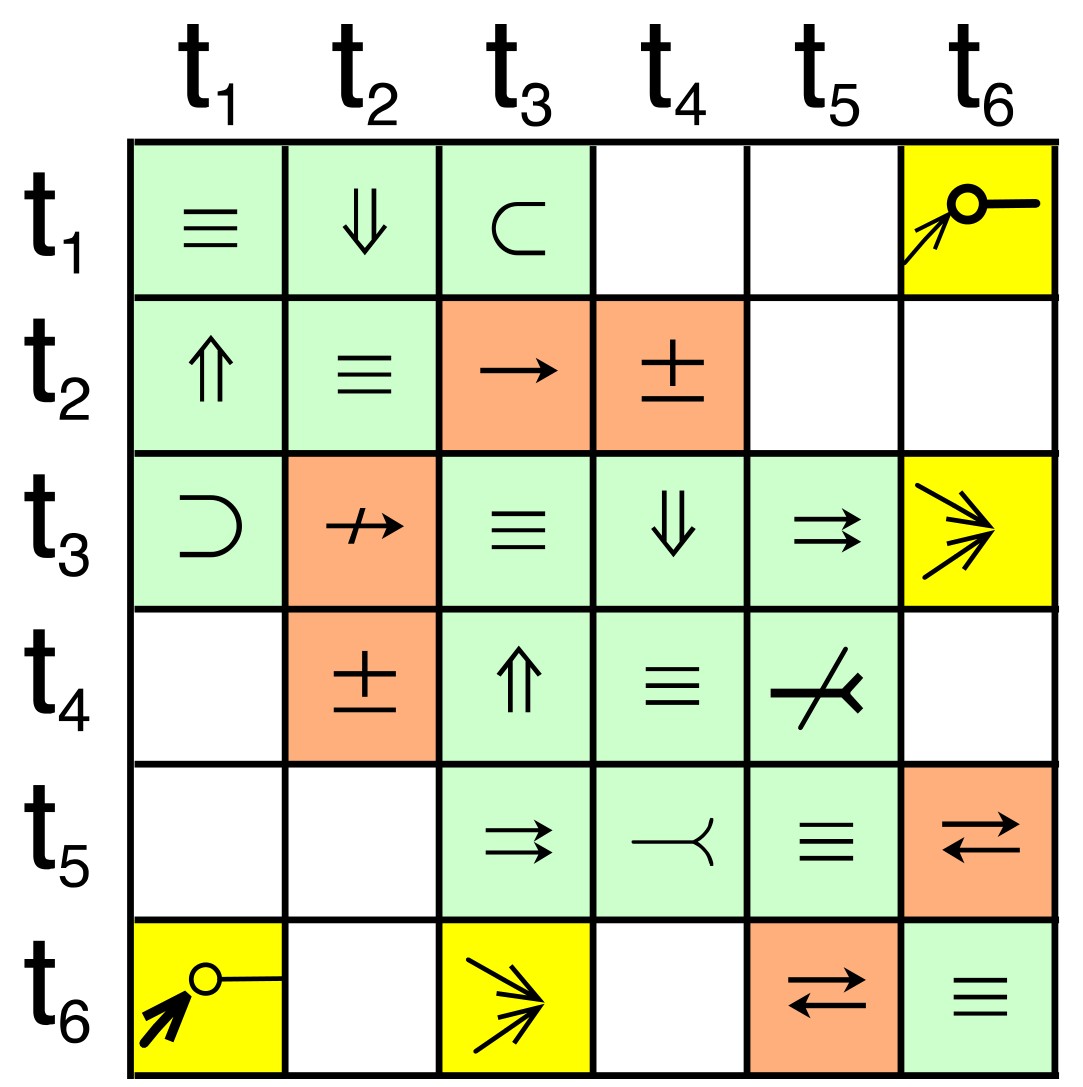
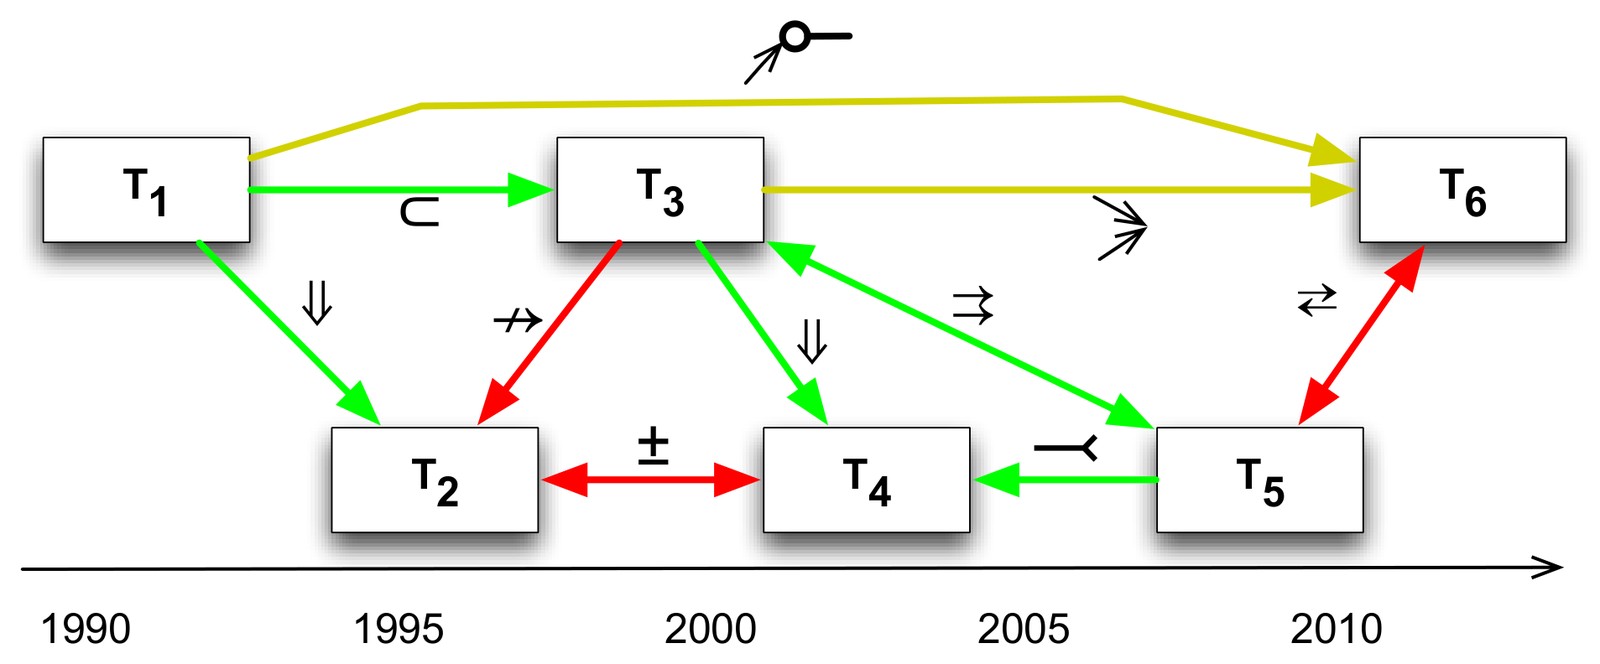
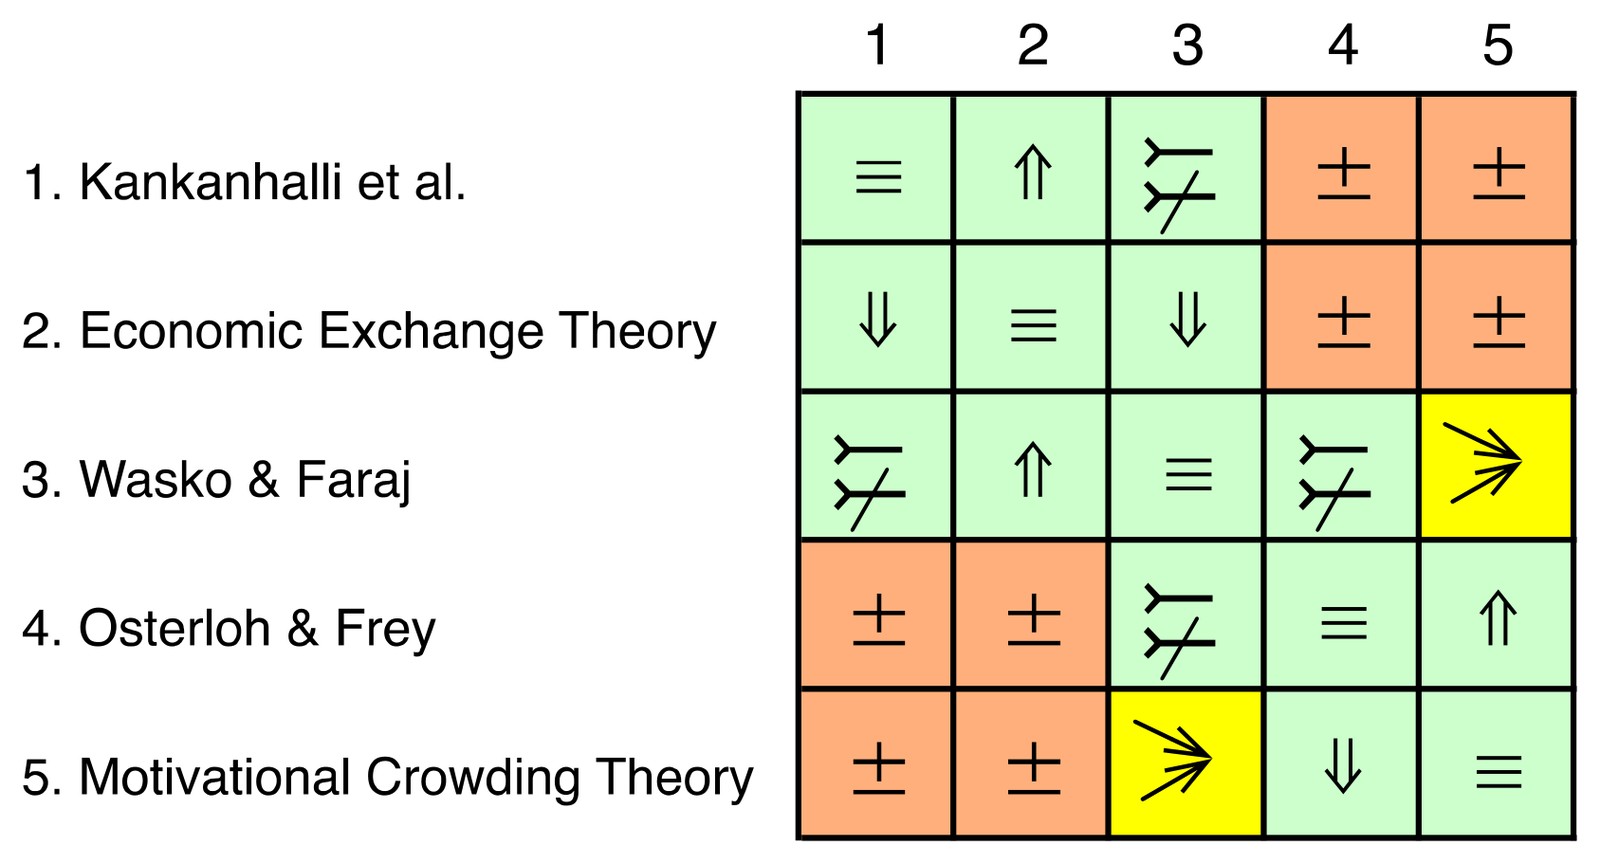
The inter-theory relationship matrix shows at a glance which theories agree (green), are connected (yellow) or contradict each other (red). The theory evolution graph places theories on a timeline and shows how later theories extend, specialise or challenge earlier ones.
Example: why do people share knowledge?
As an illustration, I described five theories on incentives for knowledge sharing with the meta-model: Kankanhalli et al., economic exchange theory, Wasko & Faraj, Osterloh & Frey, and motivational crowding theory. The matrix and the evolution graph immediately reveal the central conflict: economic theories predict that extrinsic incentives increase knowledge sharing, while motivational crowding theory predicts that monetary incentives can crowd out intrinsic motivation such as altruism (the evolution graph is shown at the top of this page).
Theory-Data Maps
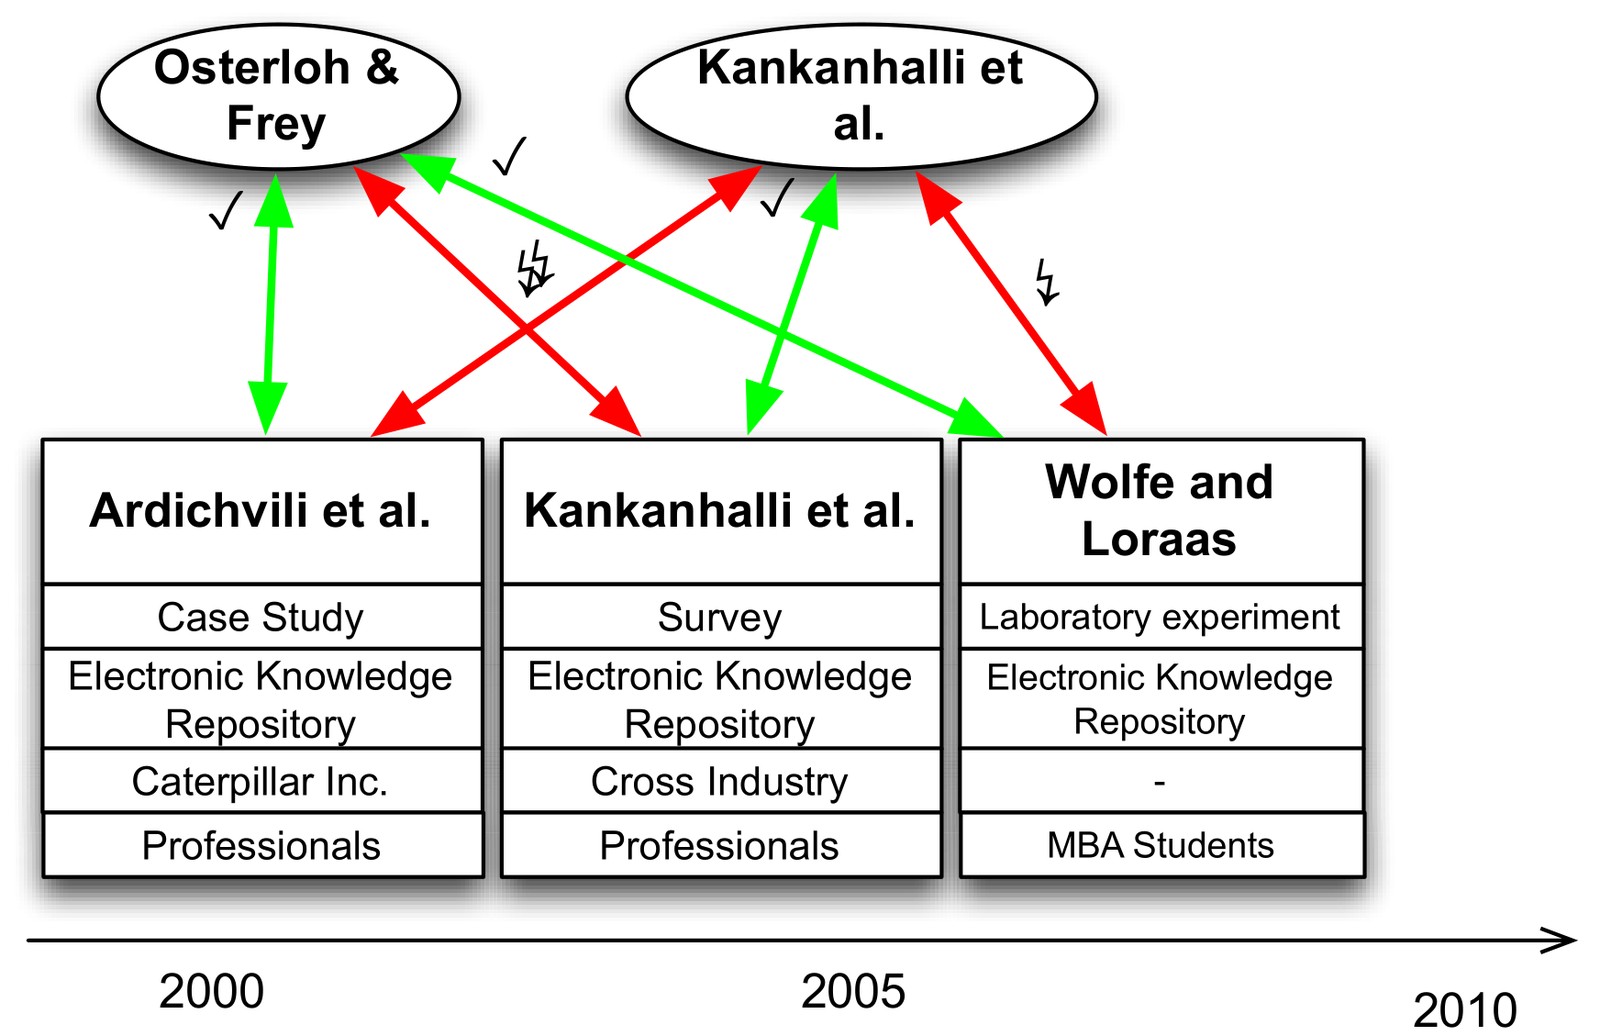
The second paper adds the data space: an empirical test consists of a research setting (method, context, technology, population) and an empirical outcome (for example, observed correlations). Given a theory and a research setting, the meta-model derives the expected empirical outcome, and compares it with the observed one. The theory-data relationship is then corroboration, falsification or unrelated.
Theory-Data Maps visualise these relationships: theories at the top, empirical tests with their research settings below, connected by green arrows for corroboration and red arrows for falsification, along a timeline.
The approach shows more clearly what the empirical merits of competing theories are, and it supports open data and replication. Its value grows with the number of papers described with the meta-model. That is why the follow-up work focused on extracting theories automatically from articles: causal-claim extraction, the Information Systems Ontology and ontology-based knowledge synthesis. The HICSS 2016 paper was nominated for the Best Paper Award.
- Mueller (2015): A Meta-Model for Inferring Inter-Theory Relationships of Causal Theories. HICSS 2015
- Mueller (2016): Theory-Data Maps: A Meta-Model and Methods for Inferring and Visualizing Relationships between Causal Theories and Empirical Evidences. HICSS 2016 (Best Paper nomination)
- Related: Causal-claim extraction
- Larsen, Saini, Singh & Mueller (Eds.) (2025): Theories Used in IS Research Wiki