
Human-centered AI Methods
Innovation methods for data- and AI-based products and business models
Design Thinking and Lean Startup put users at the centre of innovation. But many of today’s innovations start from a different resource: data. Which data does an organisation already have? Which user needs could it serve? And which AI ideas are worth pursuing before anyone writes a line of code?
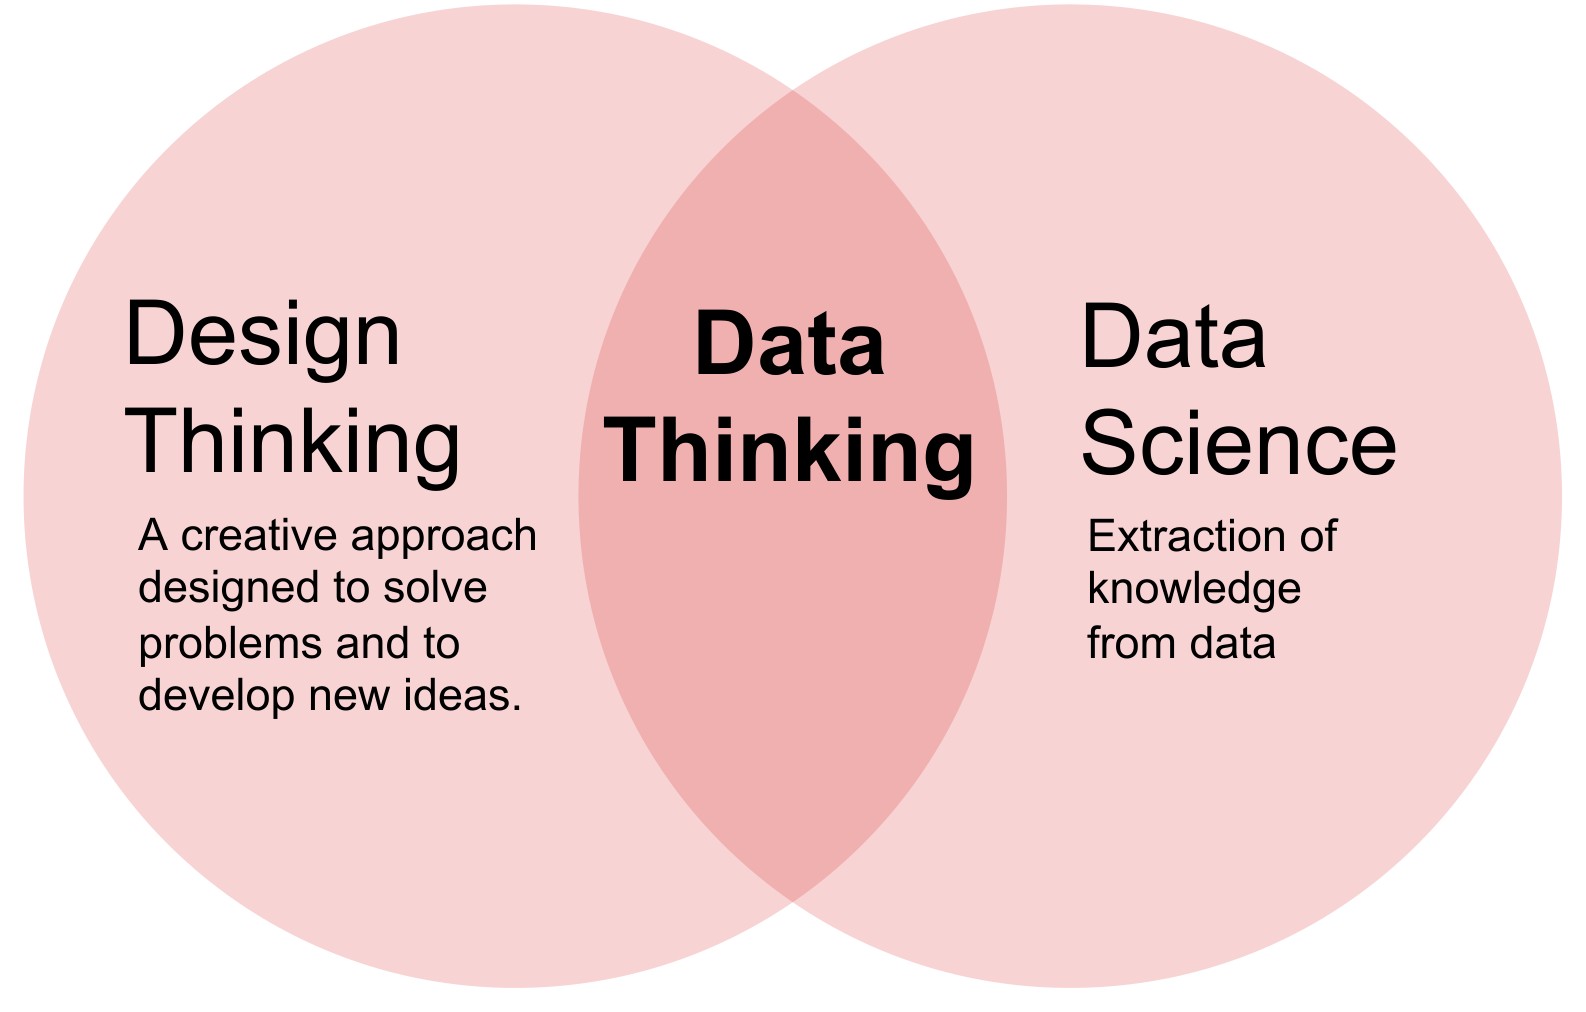
Our core approach, Data Thinking, combines the user-centred mindset of Design Thinking with the possibilities of data science and AI. Over several years, my co-authors and I have developed and tested a set of practical tools for this.
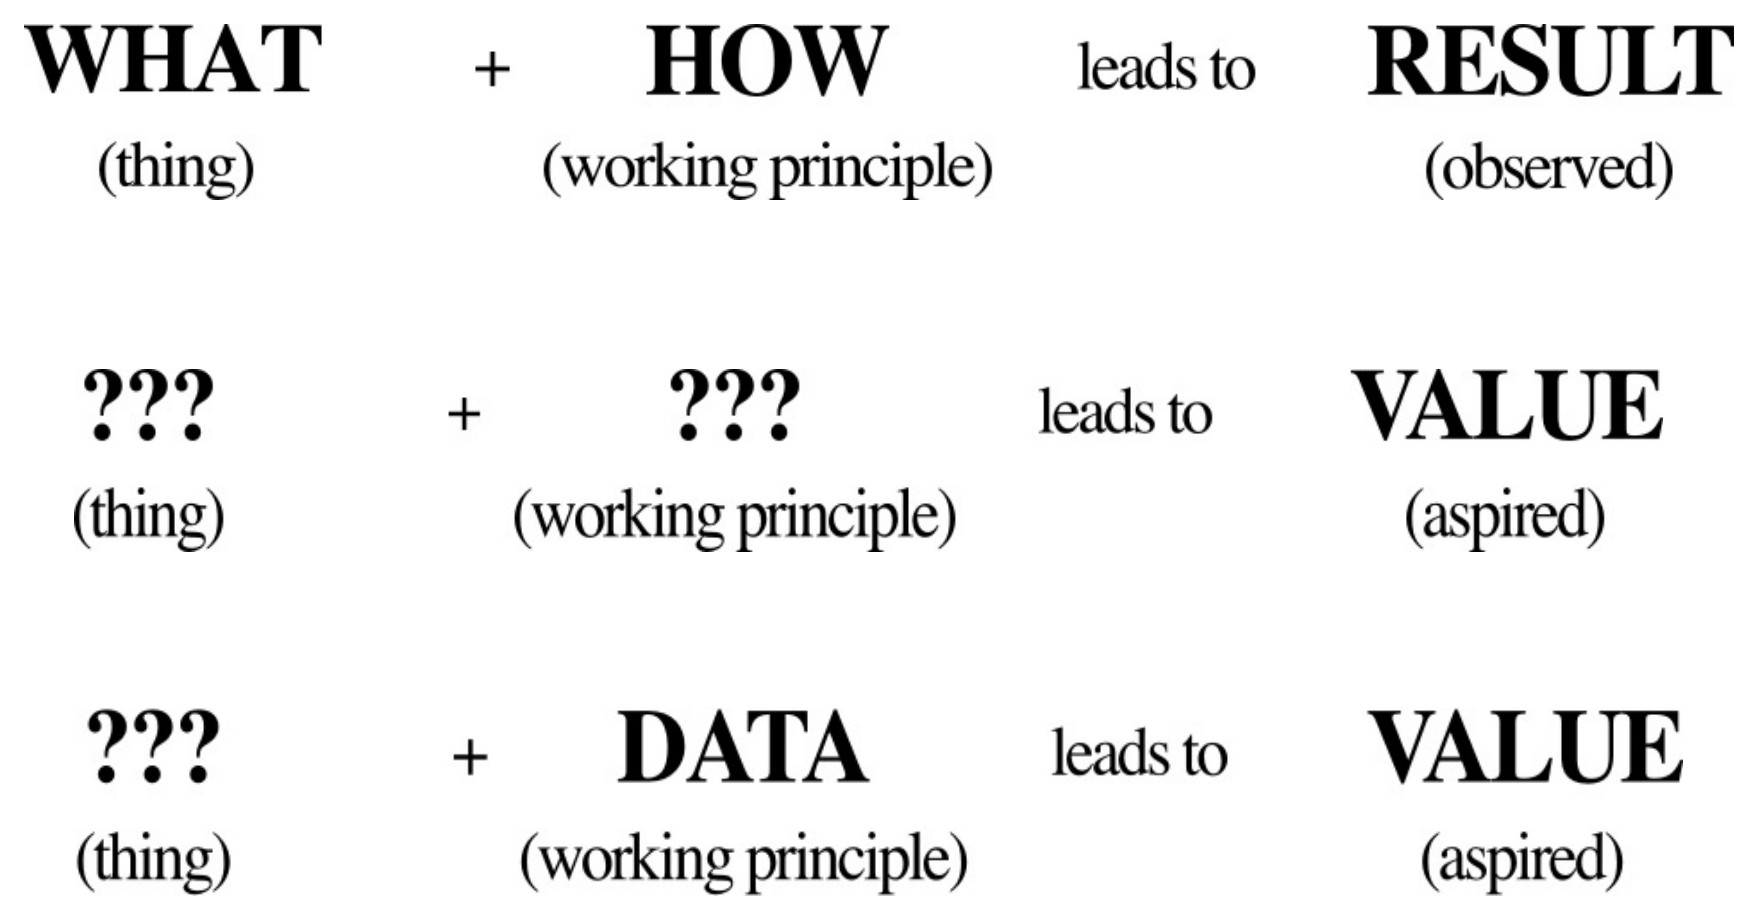
Design works by abduction: from a desired value, designers infer both the thing to create and the working principle that achieves it (Dorst, 2006). Data Thinking adds a twist: data becomes the working principle. The question is what to build so that the available data creates value.
The Data Innovation Board
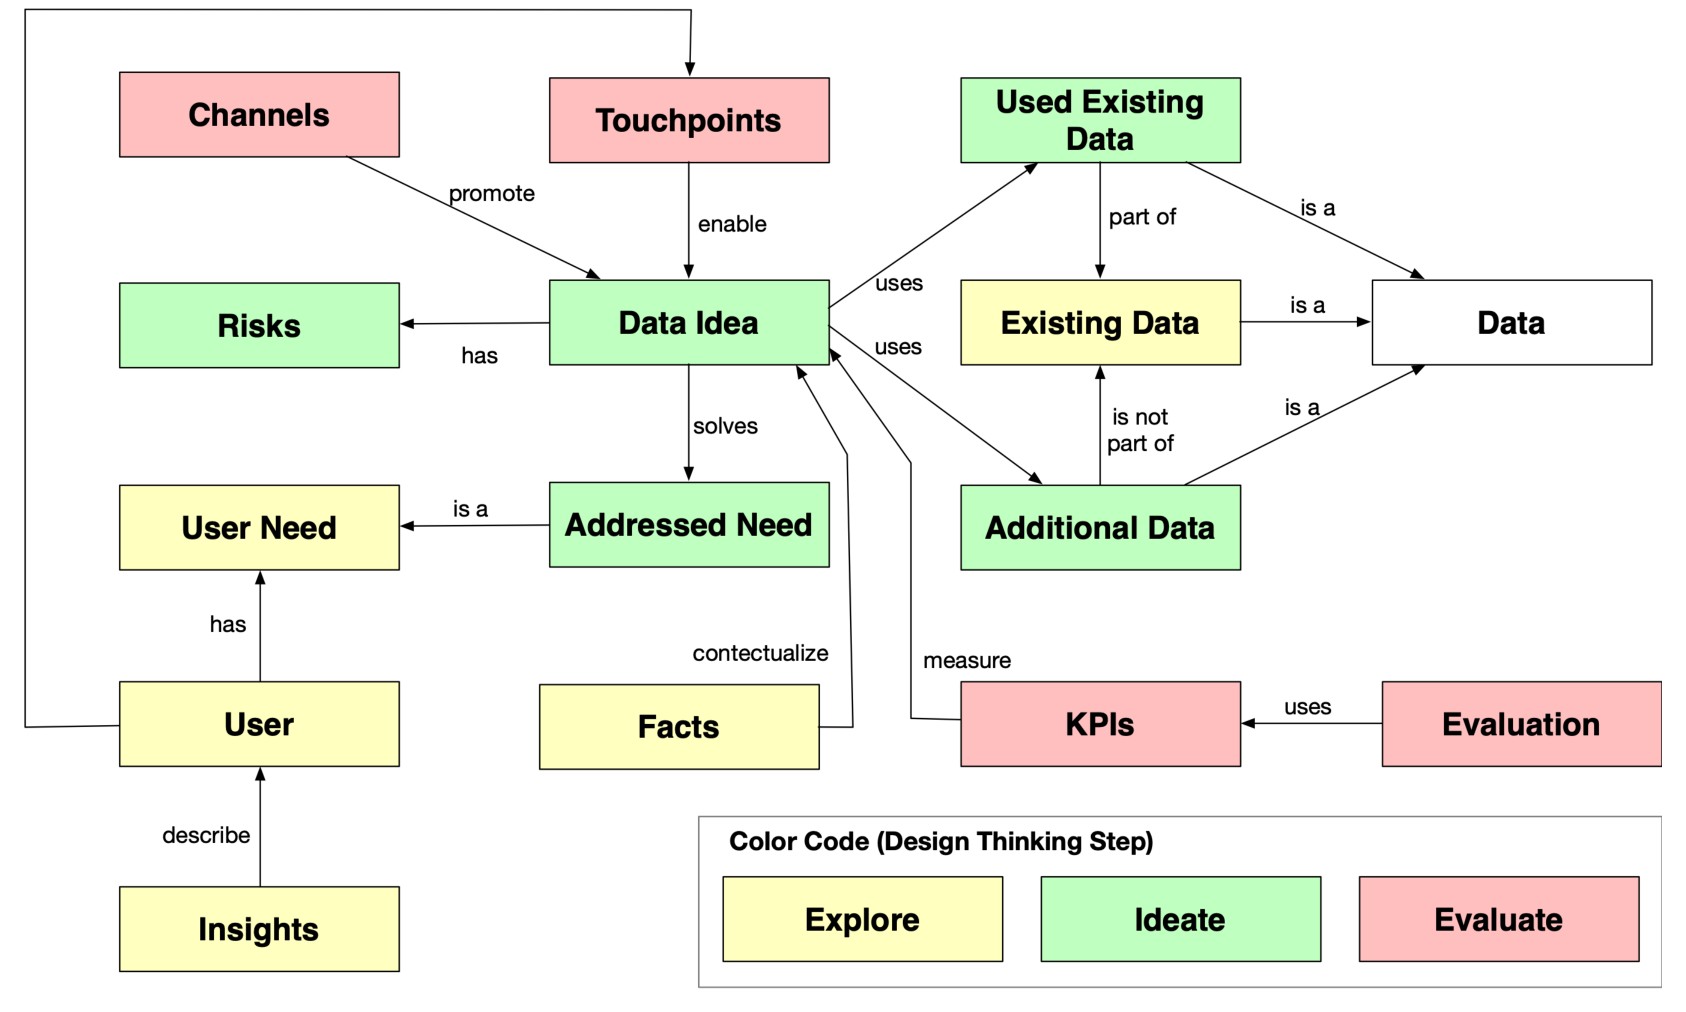
The starting point was a real problem: it is difficult to develop relevant, user-oriented use cases for data analytics projects, especially for teams that are not data experts. Related tools such as the Business Model Canvas, the Digital Innovation Playbook and the AI Canvas served as starting points. Together with Tizian Kronsbein, I developed the Data Innovation Board (HICSS 2019) using action design research, following three principles for collaborative tools: frame the problem with an ontology, turn it into a visual canvas, and let teams prototype solutions on it with sticky notes.
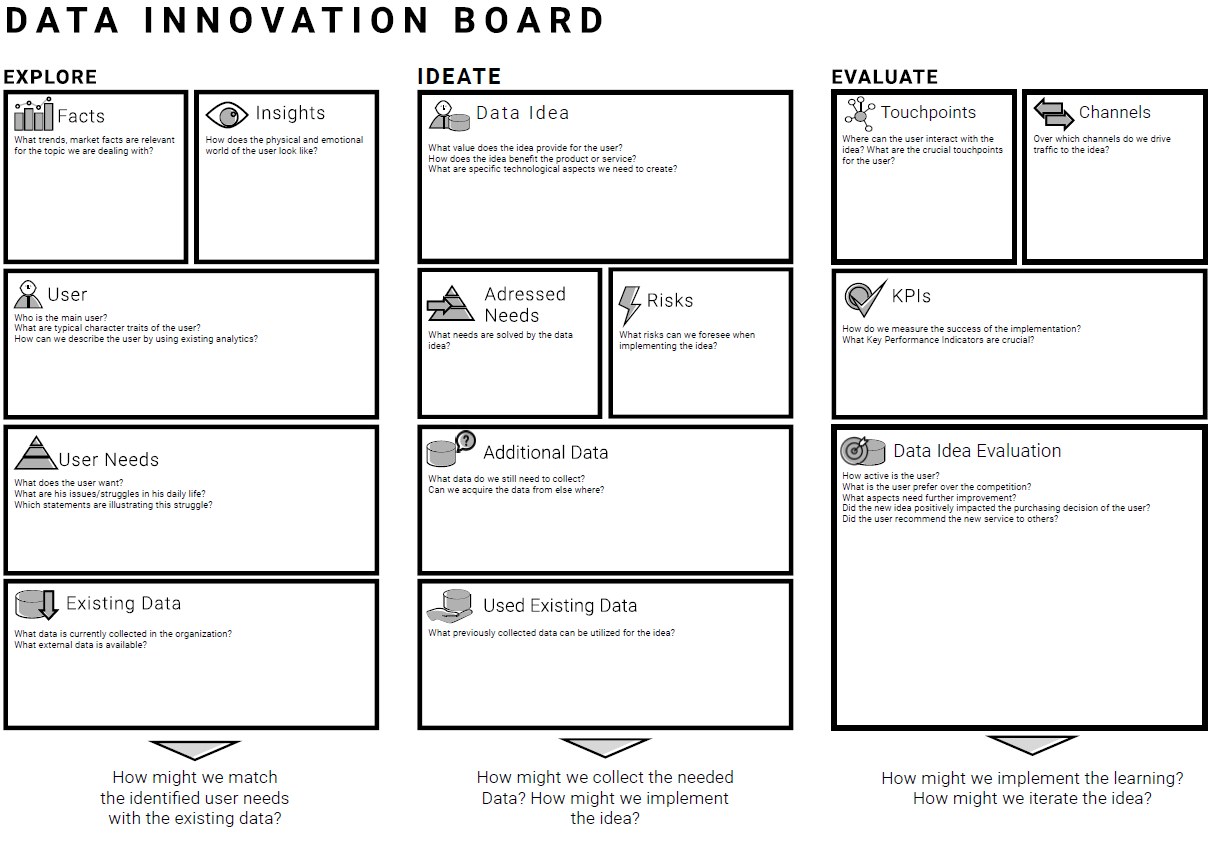
The board (shown at the top of this page) guides teams through three phases, each closing with a linking question:
- Explore: facts, user insights, user needs and the data that already exists in the organisation. How might we match the identified user needs with the existing data?
- Ideate: the data idea, the needs it addresses, its risks, and which existing and additional data it requires. How might we collect the needed data, and how might we implement the idea?
- Evaluate: touchpoints, channels, KPIs and an evaluation of the data idea with users. How might we implement the learning and iterate the idea?
We evaluated the board for practicality and usefulness in three workshops, triangulating interviews, video recordings and questionnaires:
| Workshop | Participants | Data literacy | Context | Data Thinking challenge |
|---|---|---|---|---|
| 1 | 12 in 2 groups | low | Media publishing | How could a more data-driven solution for a magazine look like? |
| 2 | 5 | medium | Corporate learning | How could the user experience be improved through data? |
| 3 | 7 | high | University project | What can we do with data to reduce the uncertainty for investors in cryptocurrencies? |
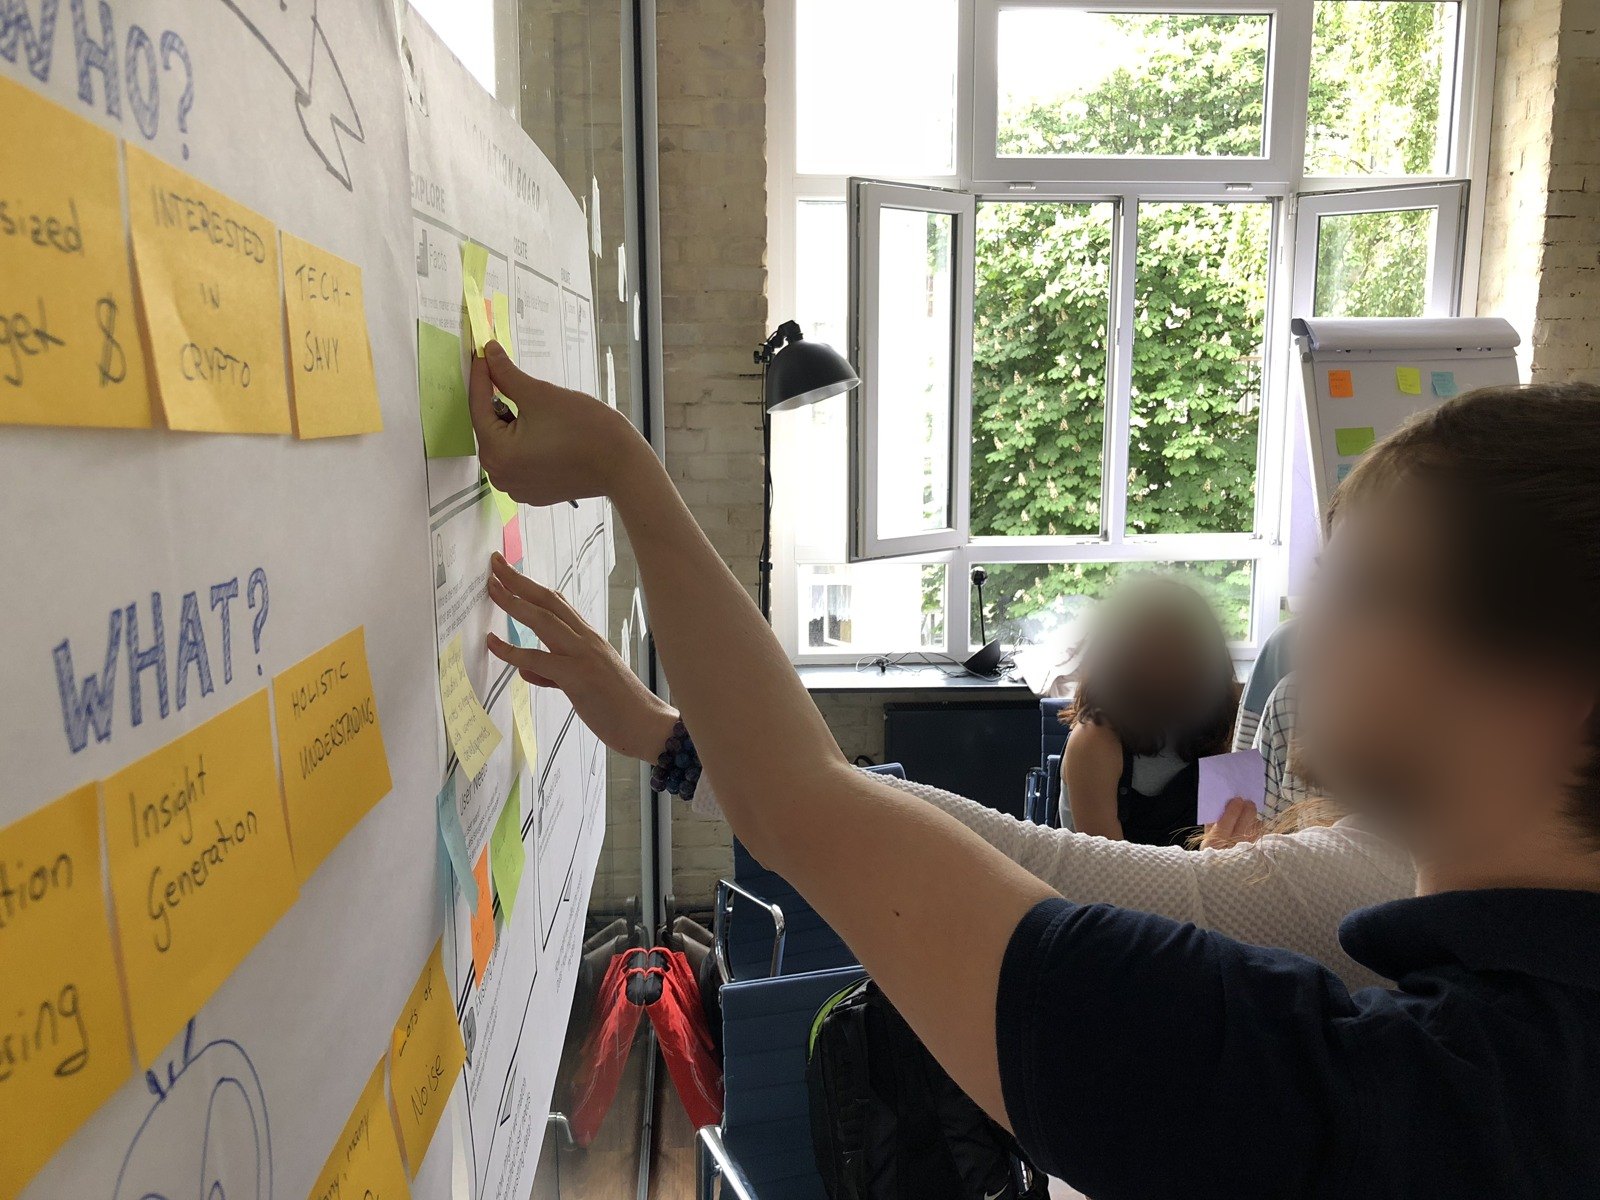
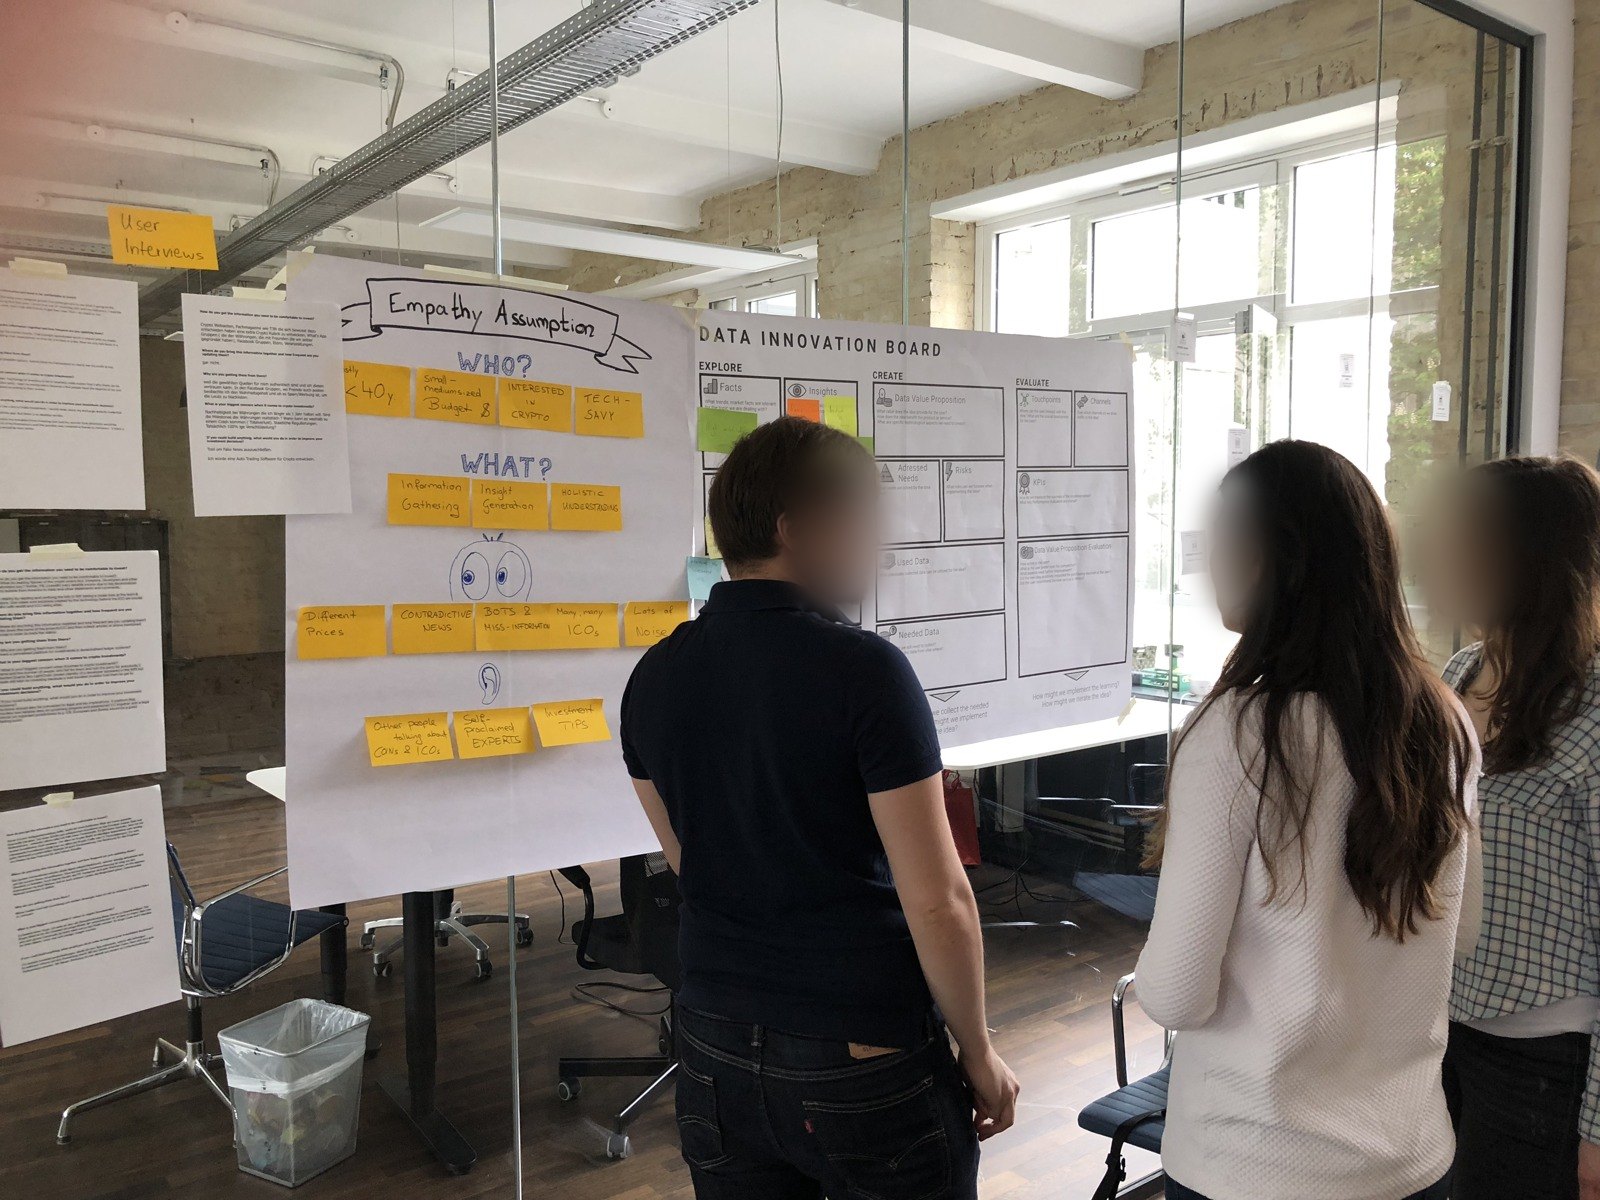
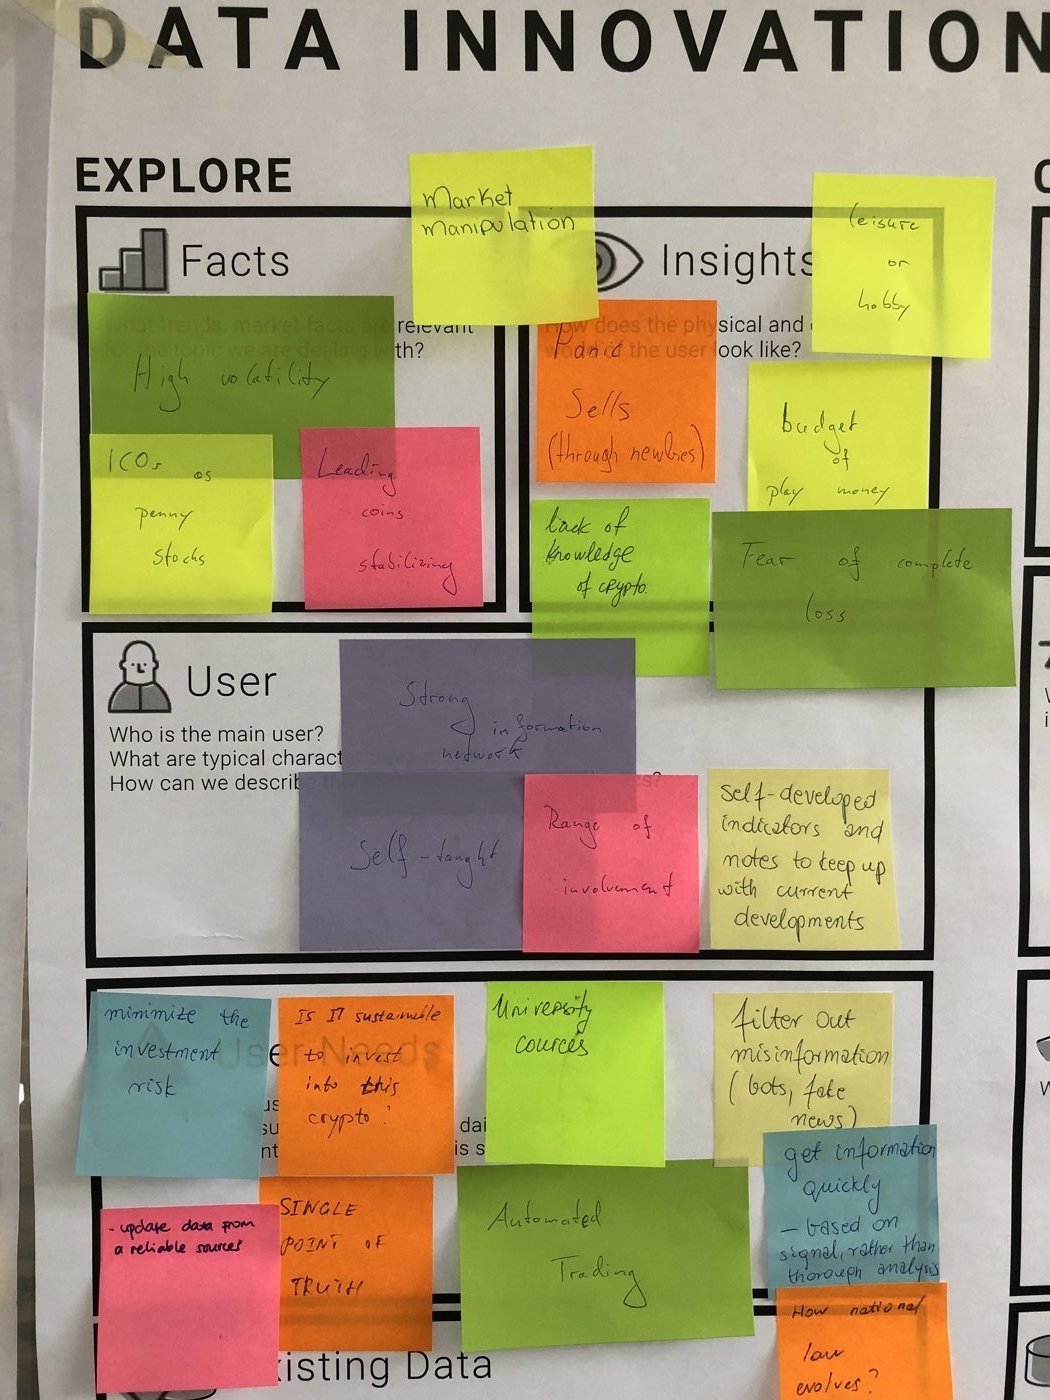
The workshops led to a revised canvas: touchpoints moved to the evaluate phase, the former “user data artefacts” were split into data idea, additional data and used existing data, and linking questions were added between the phases. They also showed that the participants’ data literacy is critical for the outcome.
The Data Collection Map
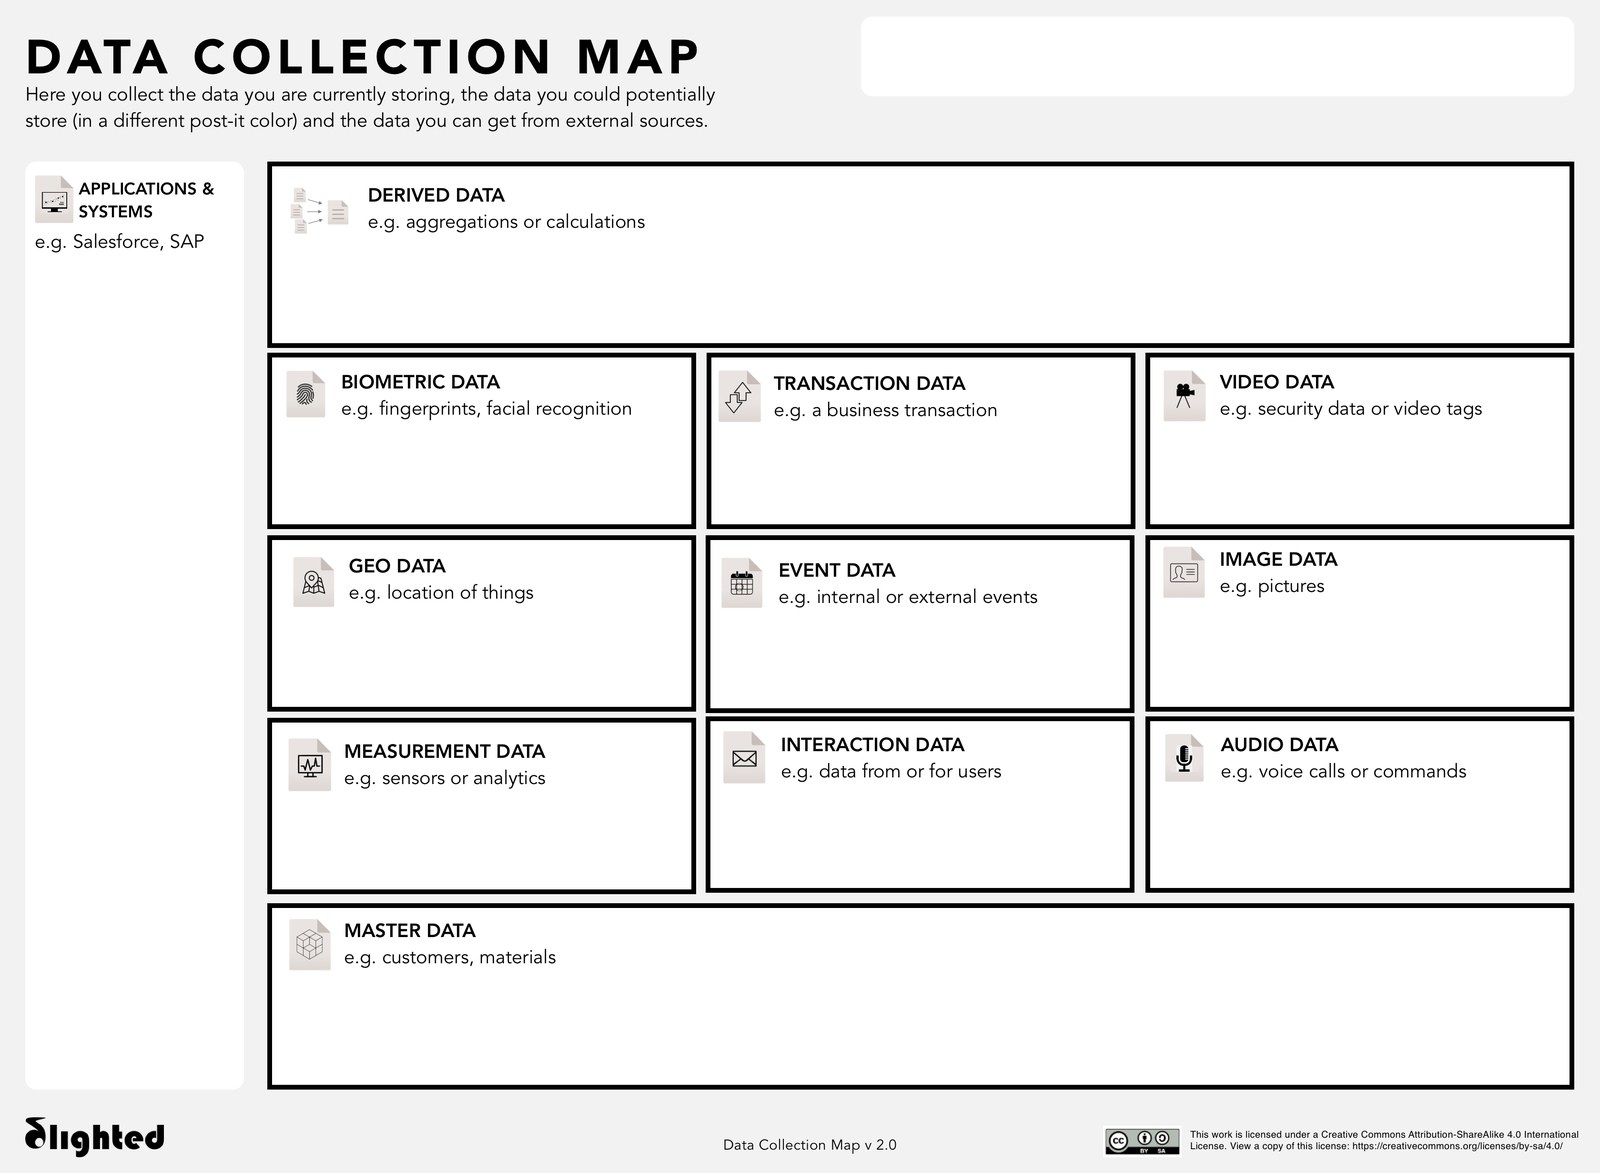
Data-driven ideas often fail because nobody has an overview of the available data. The Data Collection Map (Pre-ICIS SIGDSA Symposium 2019, with L. Kayser and Tizian Kronsbein) creates shared data awareness: teams collect the data they currently store, the data they could store, and the data they could obtain from external sources, sorted by type, from transaction, event and interaction data to image, audio and biometric data.
What makes data-driven innovation valuable?
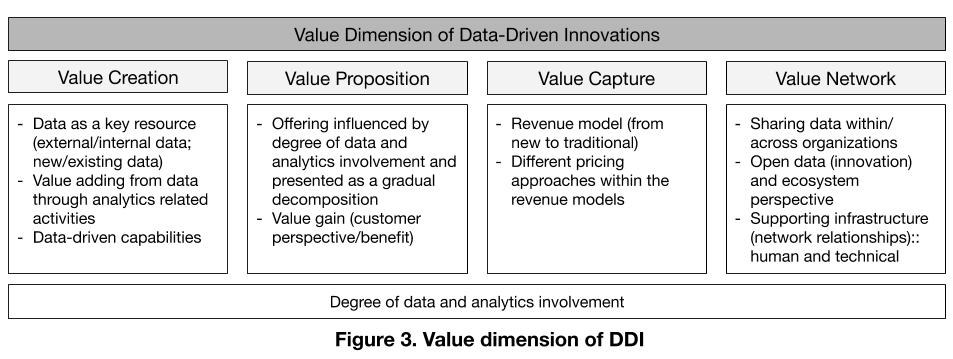
A structured literature review on classification approaches for data-driven innovations (HICSS 2021) shows that their value can be described along four dimensions: value creation, value proposition, value capture and value network, each depending on the degree of data and analytics involvement.
The Idea Arc: a canvas for fuzzy ideas
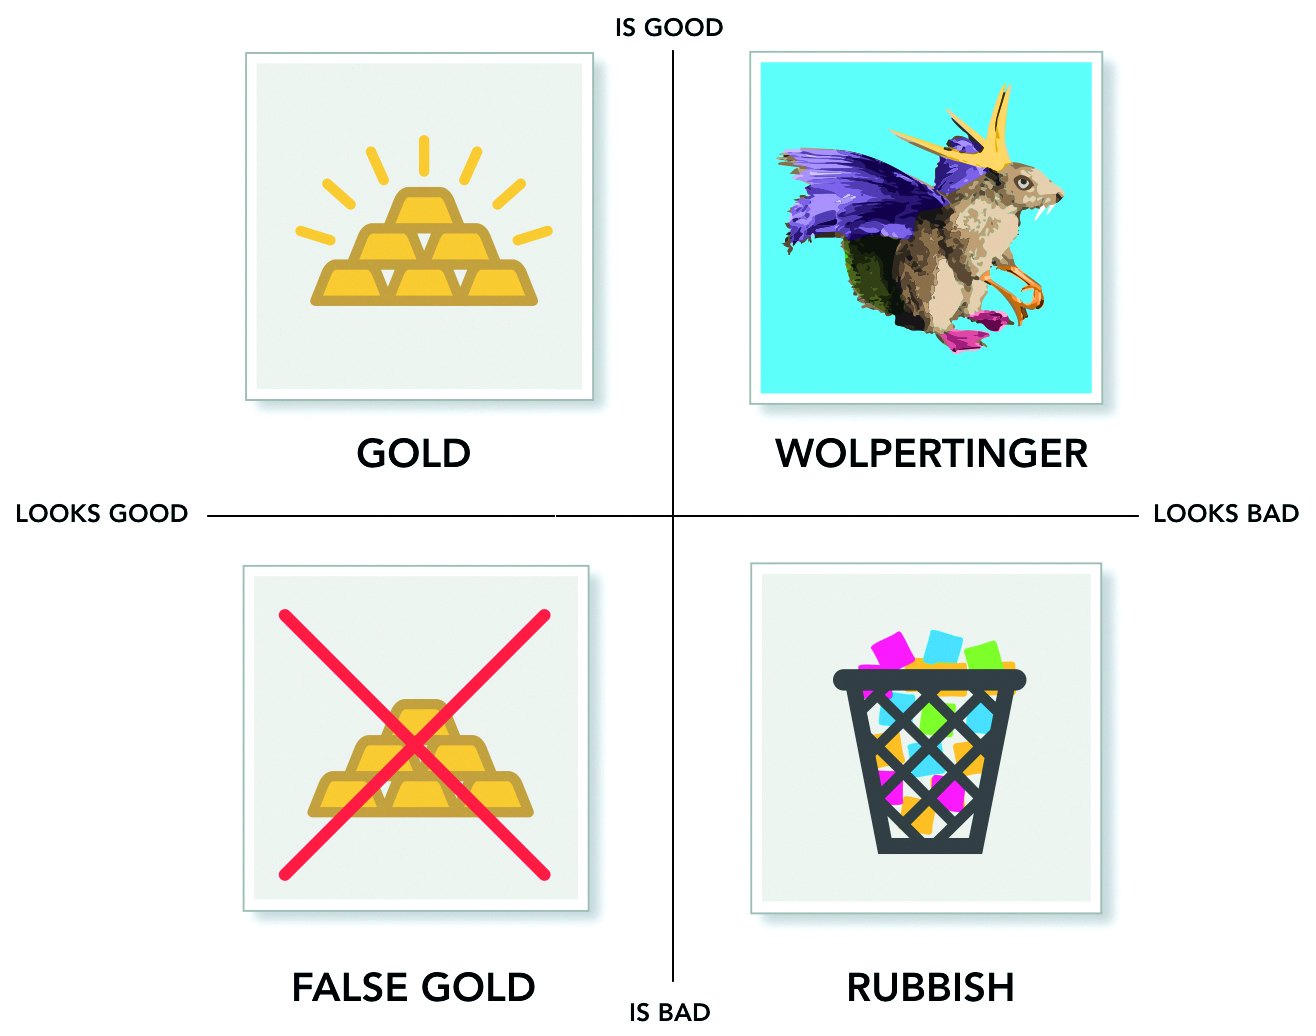
In Bavarian folklore, the Wolpertinger is a creature assembled from the parts of many animals: the head of a hare, the antlers of a deer, the wings of an eagle. Early ideas at the fuzzy front end of innovation often look just as odd: parts are missing, unconnected or do not fit. Companies tend to focus on avoiding false positives, investing in ideas that look good but fail. Promising ideas that look bad at first glance are rejected too early, and the opportunity is missed.
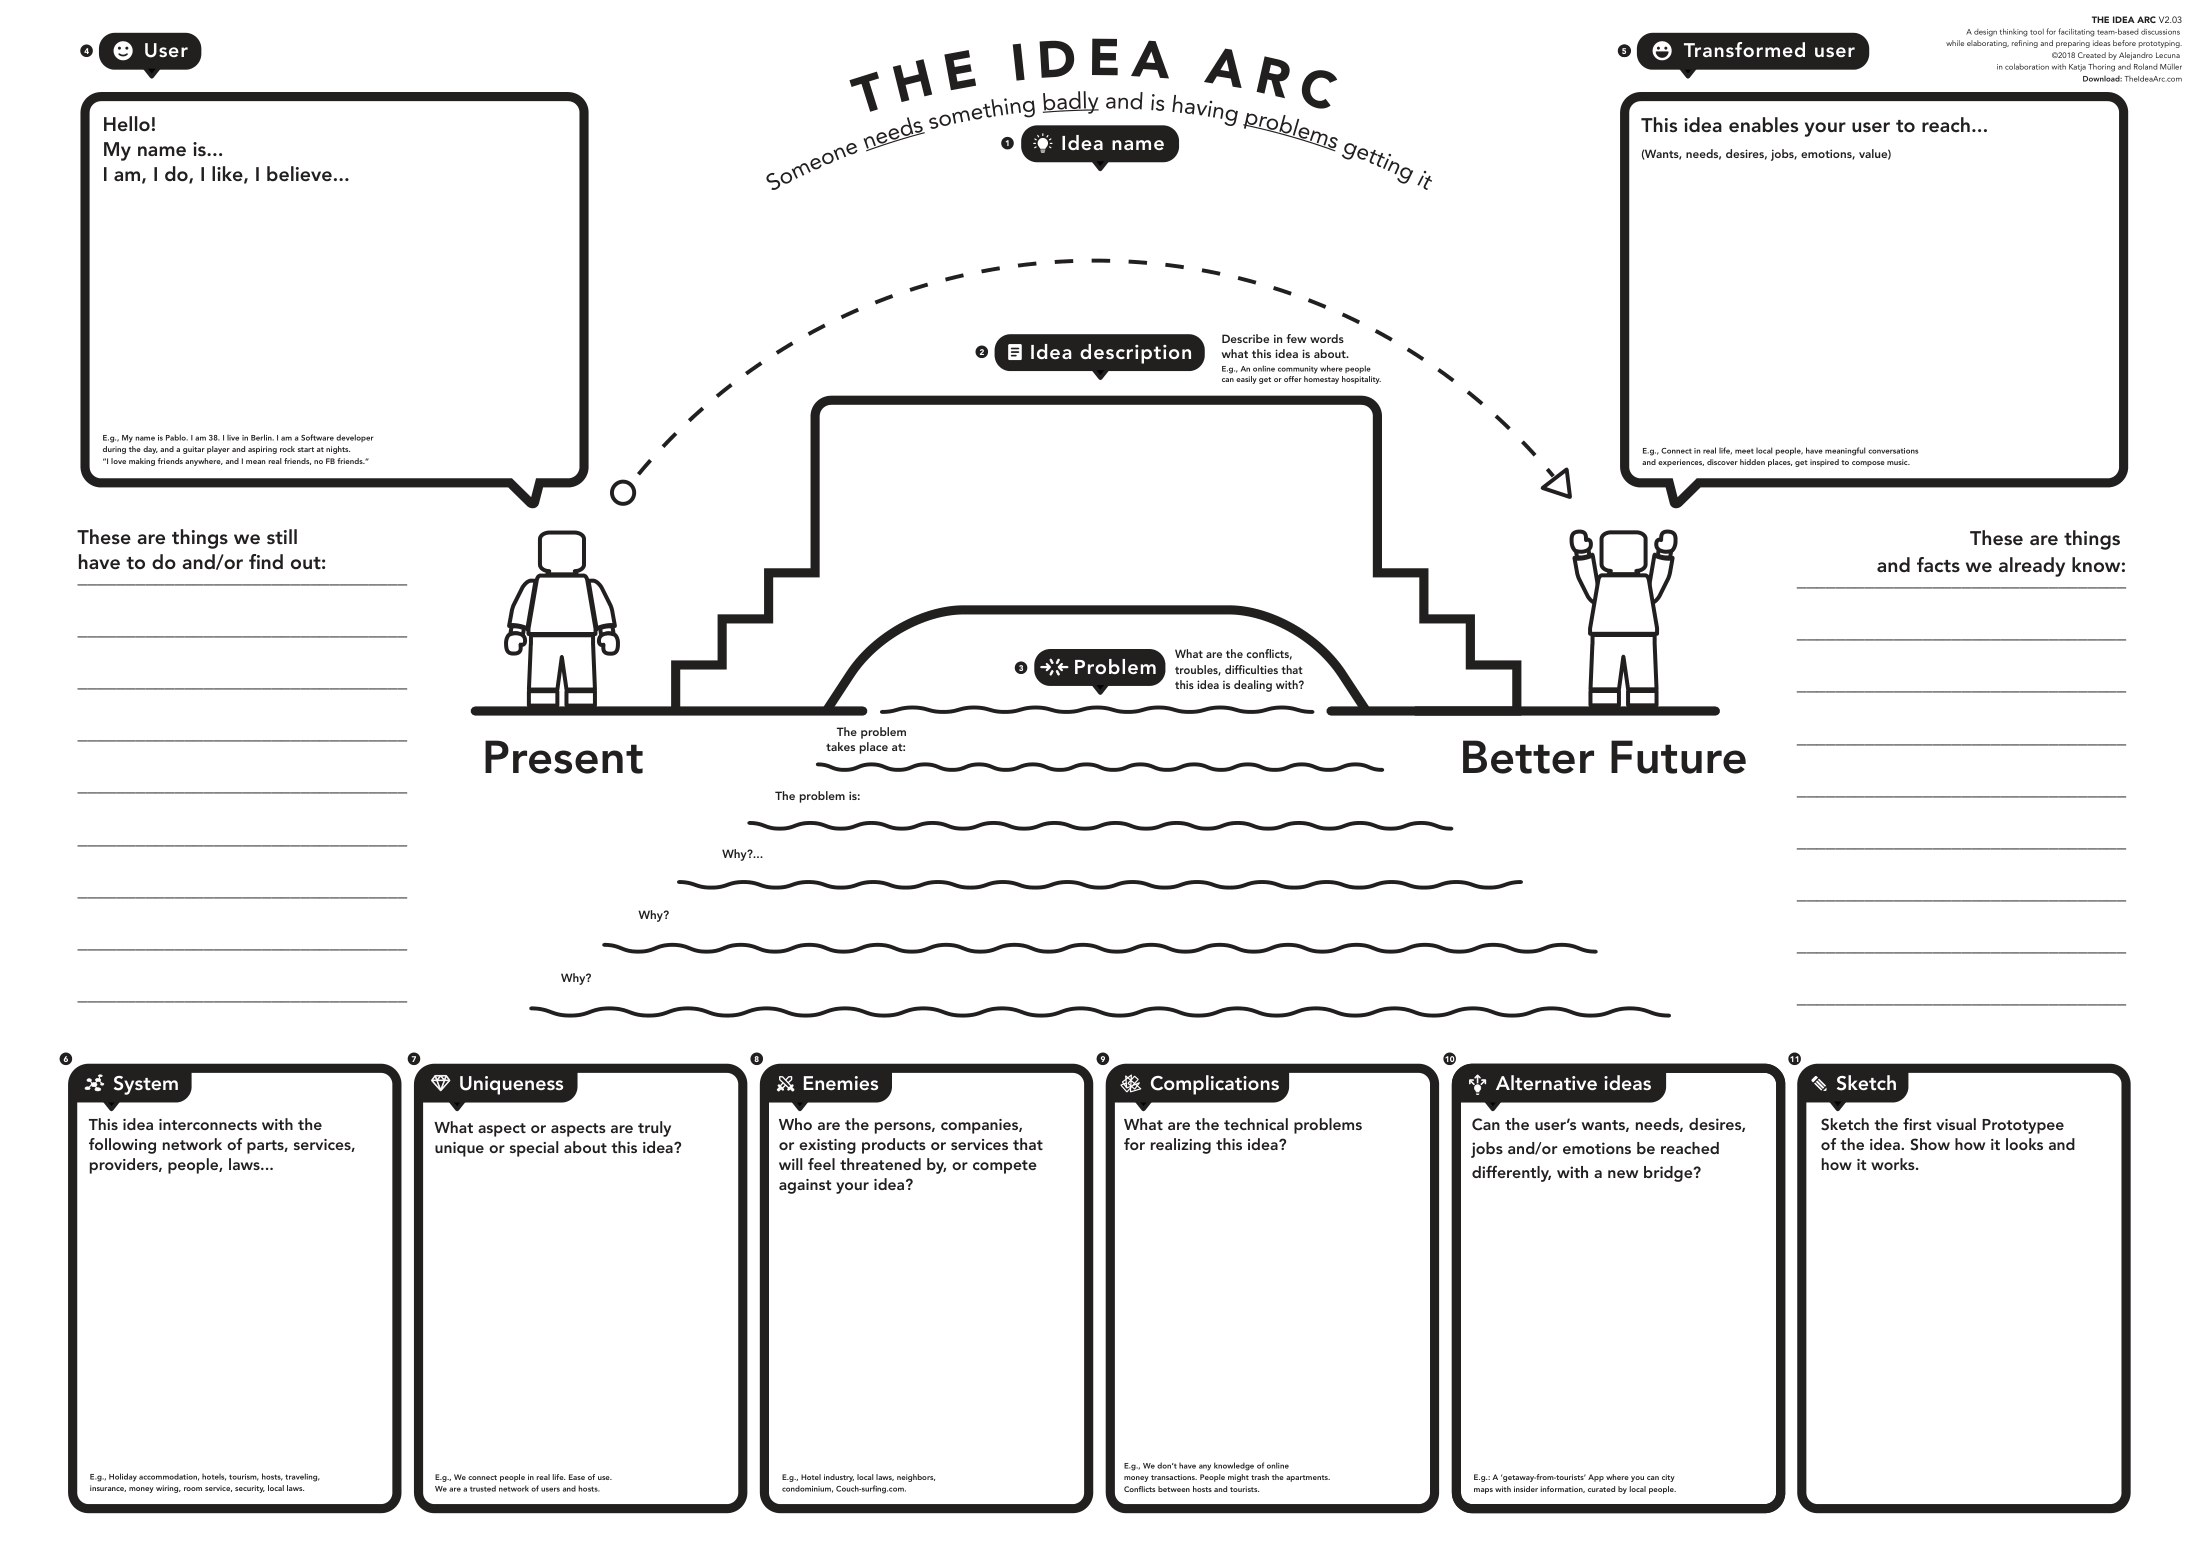
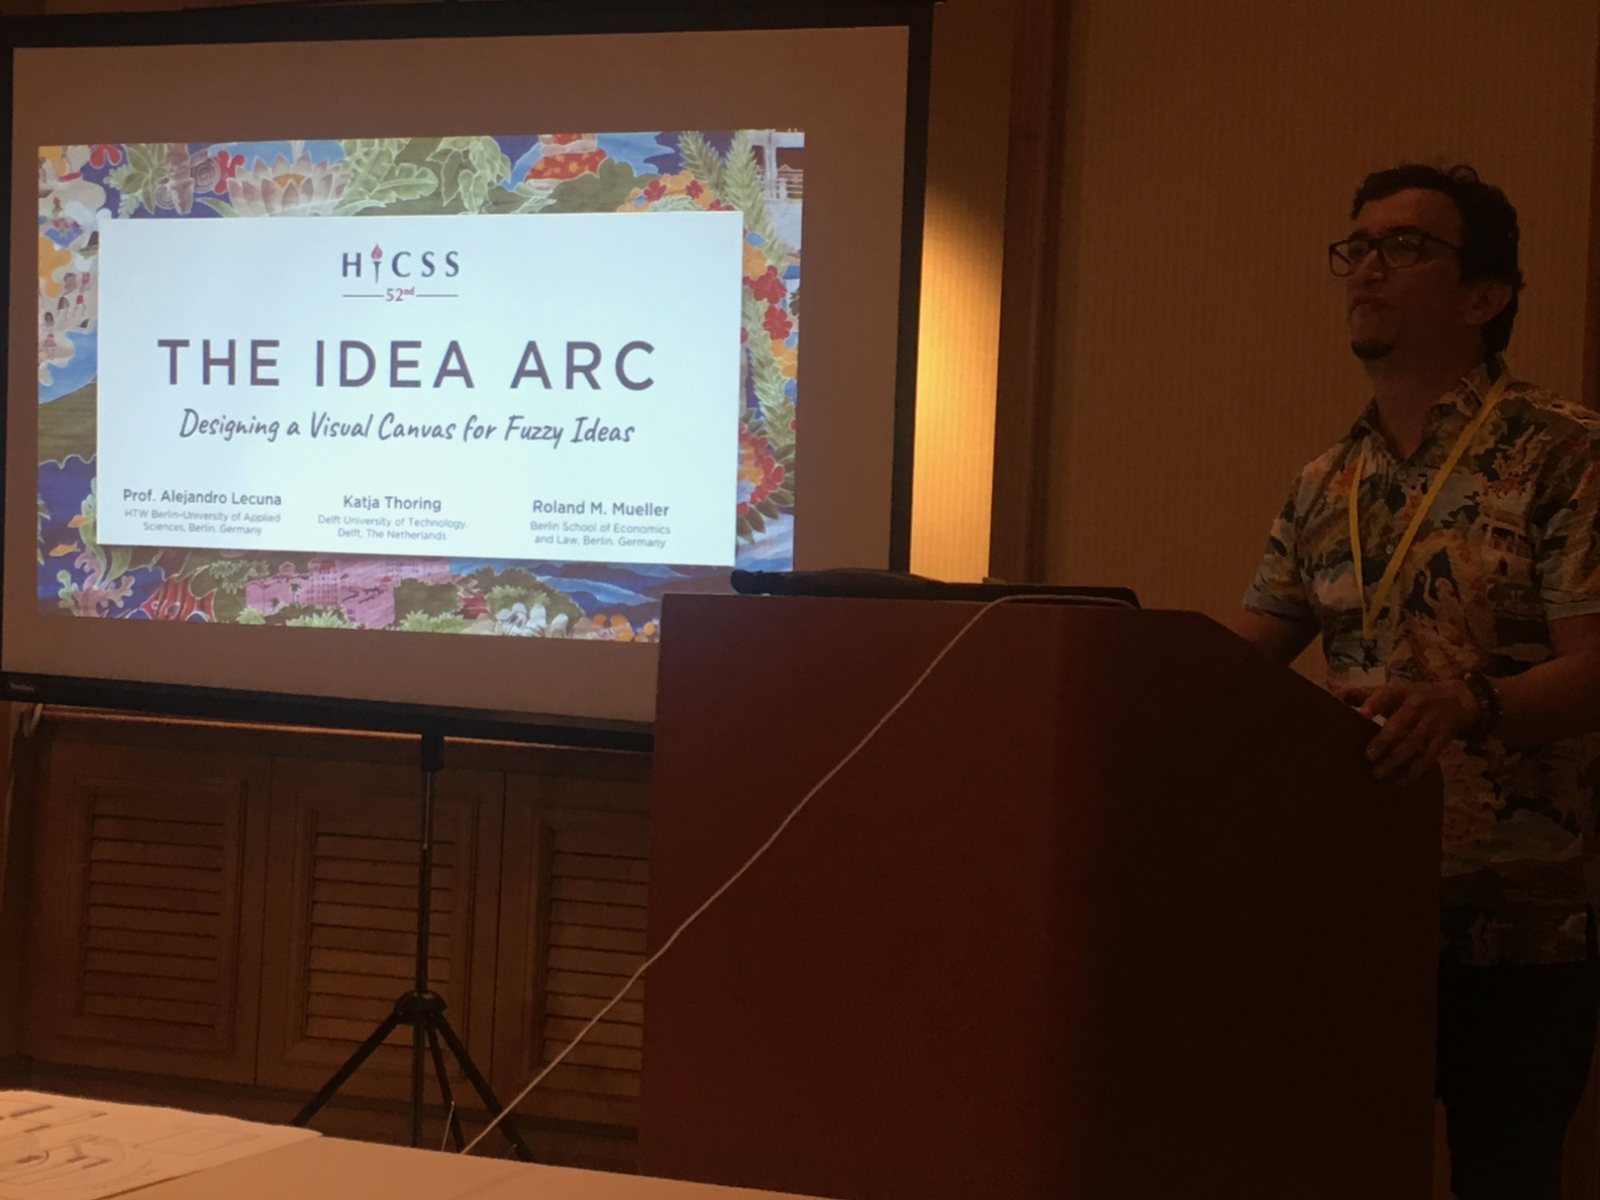
With Alejandro Lecuna and Katja Thoring, I developed the Idea Arc, a canvas that helps teams elaborate and refine such ideas before they prototype them (HICSS 2019). Interviews with innovation experts from three organisations led to an ontology of 14 concepts, from idea, principle and problem to user, known and unknown facts, similar and alternative ideas, and context. The canvas translates this ontology into a visual metaphor: a user crosses a bridge from the present to a better future.
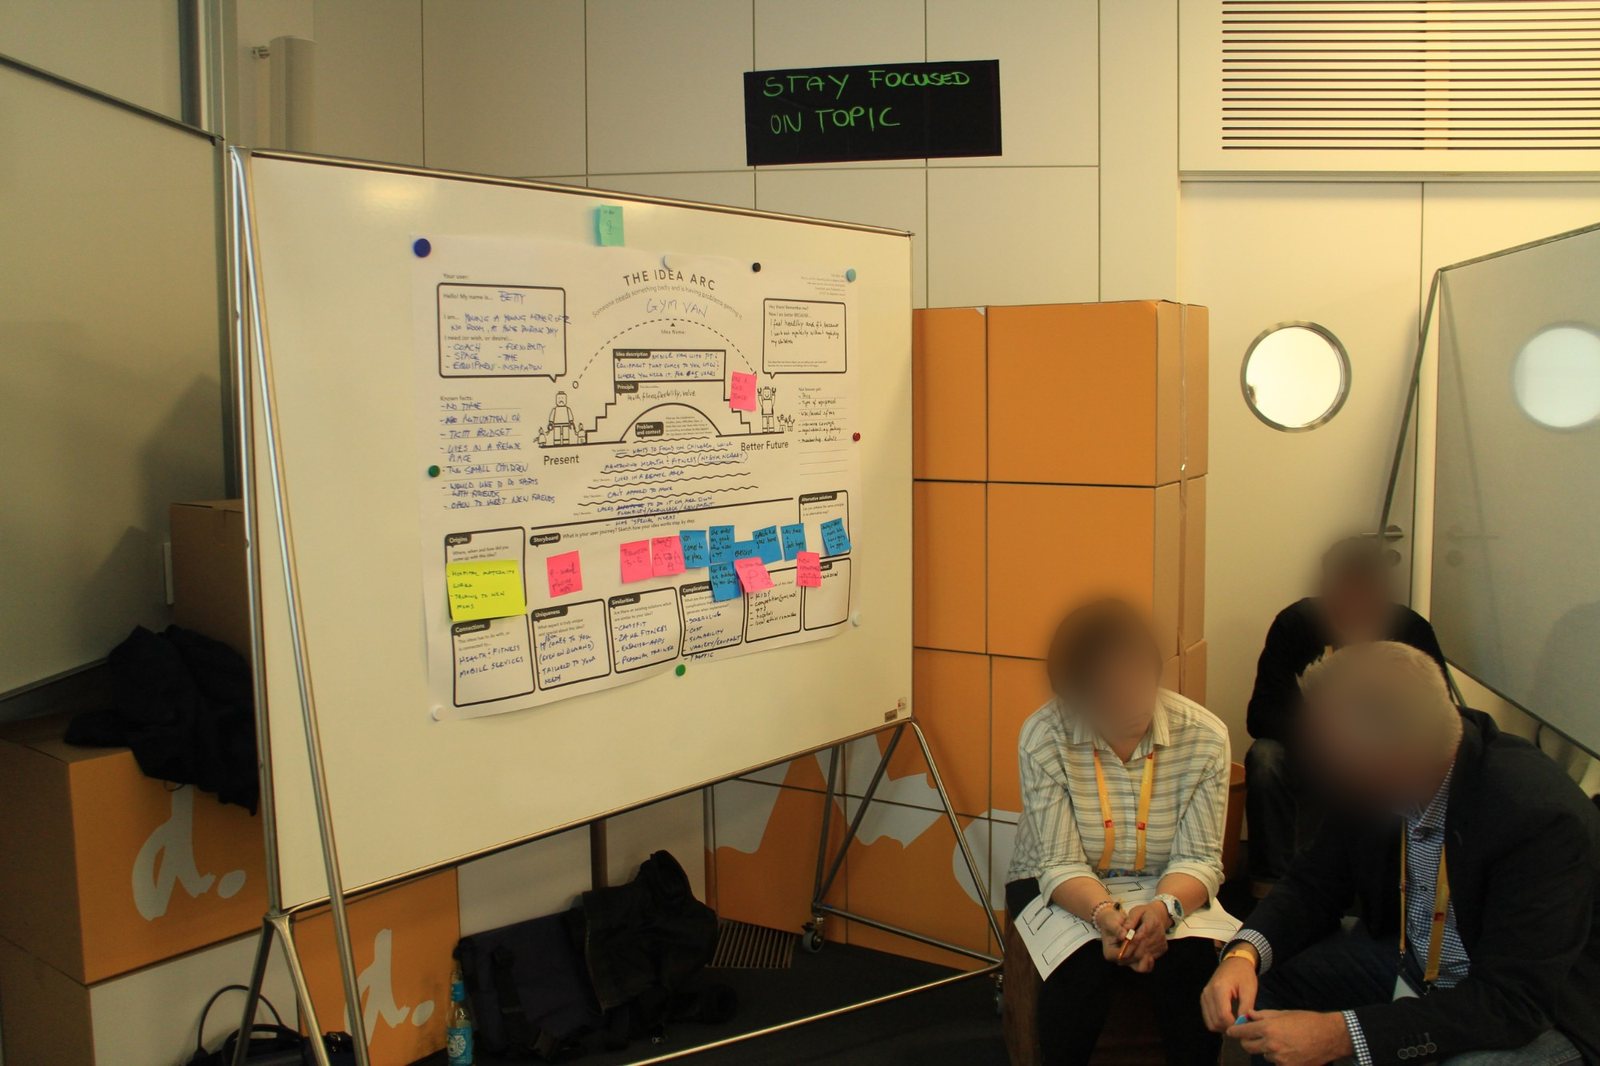
We tested the canvas in two workshops. In an academic workshop at the d.confestival 2017, the design thinking conference of the Hasso Plattner Institute in Potsdam, 40 participants in six teams refined fictitious fuzzy ideas, and their work showed how to improve the canvas’s layout for the next version. In a three-day workshop with an international retail group, 32 employees refined six of the company’s own “weak” ideas and then prototyped and tested them with customers. Video recordings of the pitches before and after showed that the ideas had become easier to understand, the teams used the canvas to decide what exactly to prototype, and most idea owners significantly improved their ideas, even when they had been attached to their first version. As the company’s innovation manager put it, the teams were “working faster than in prior design innovation workshops”.
Which AI use cases to pursue?
Organisations have countless ideas for data and AI, but most data initiatives never deliver: an often-cited figure is that 85% of data and analytics projects do not make it into production. One reason is the lack of a systematic way to screen use cases before investing in them. Without defined criteria, decision makers either miss valuable opportunities or fund use cases that lead nowhere, and the later a weak idea is stopped, the more expensive it becomes.
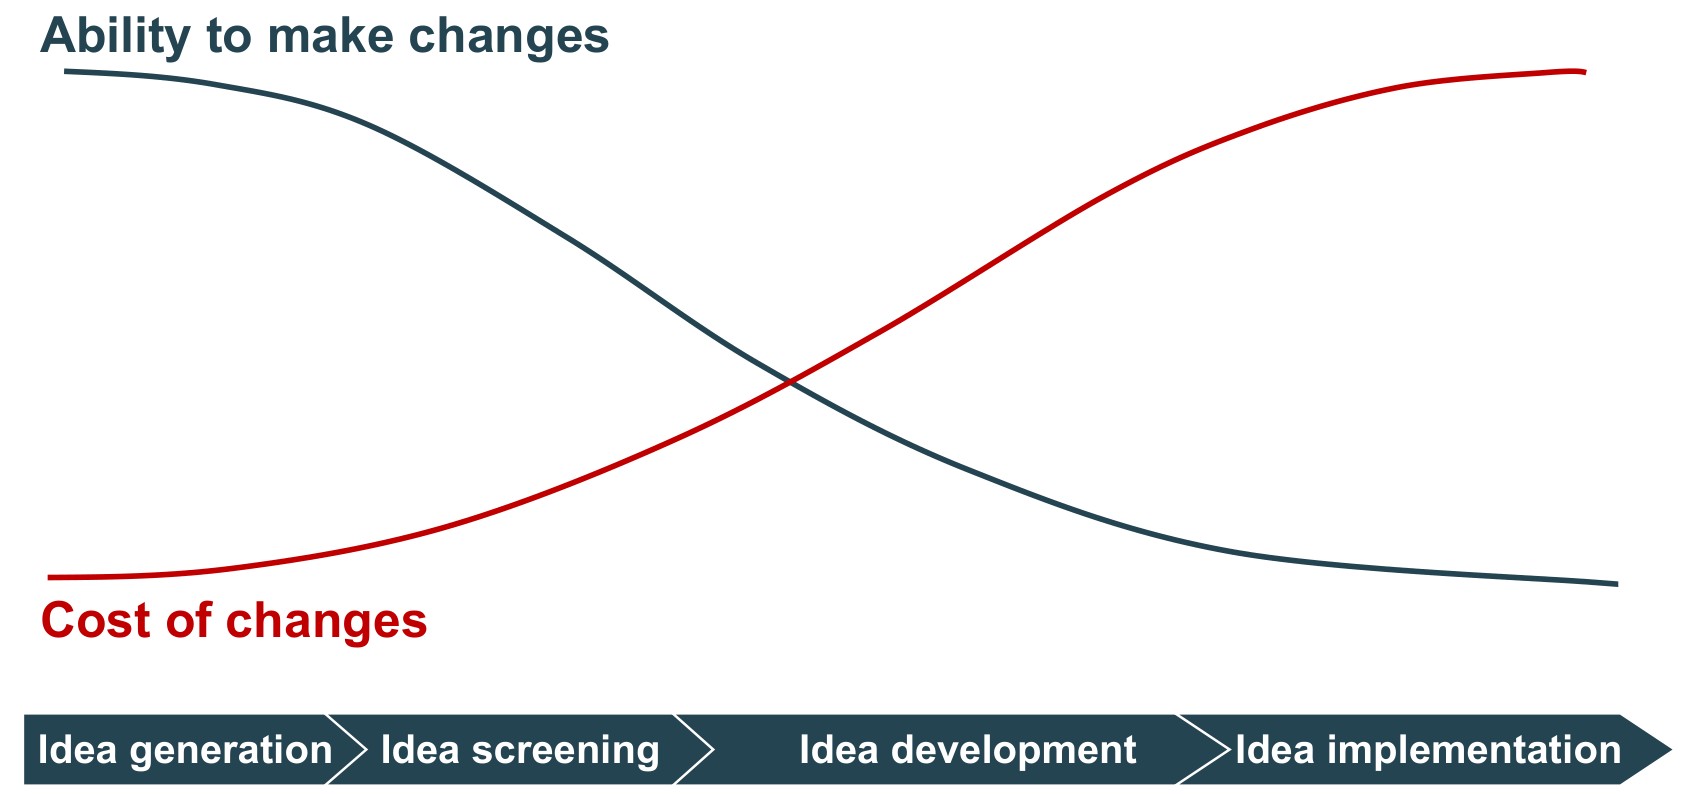
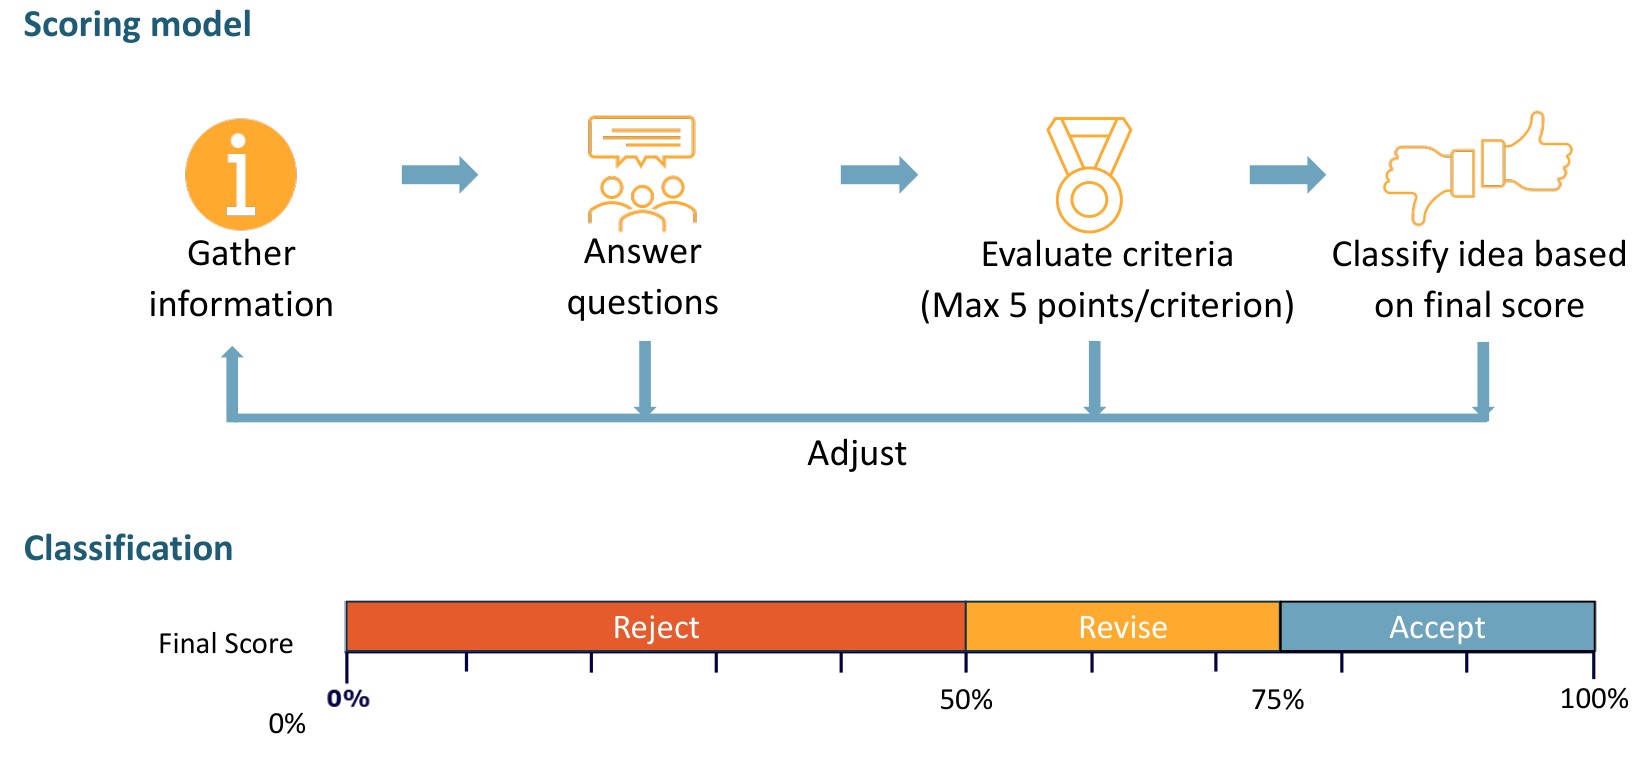
With Dustin Schwarz (DAIN Studios) and Michael List (Bundesdruckerei), I developed a framework for the early evaluation of data and analytics use cases (HICSS 2023) in close collaboration with Bundesdruckerei GmbH, the German government-owned IT security company that produces ID documents, driving licences and banknotes. Following action design research, it was built and evaluated in three cycles with data scientists, engineers, process owners and project managers, and first tested on a real use case: predicting the quality of passports from actuator data in production.
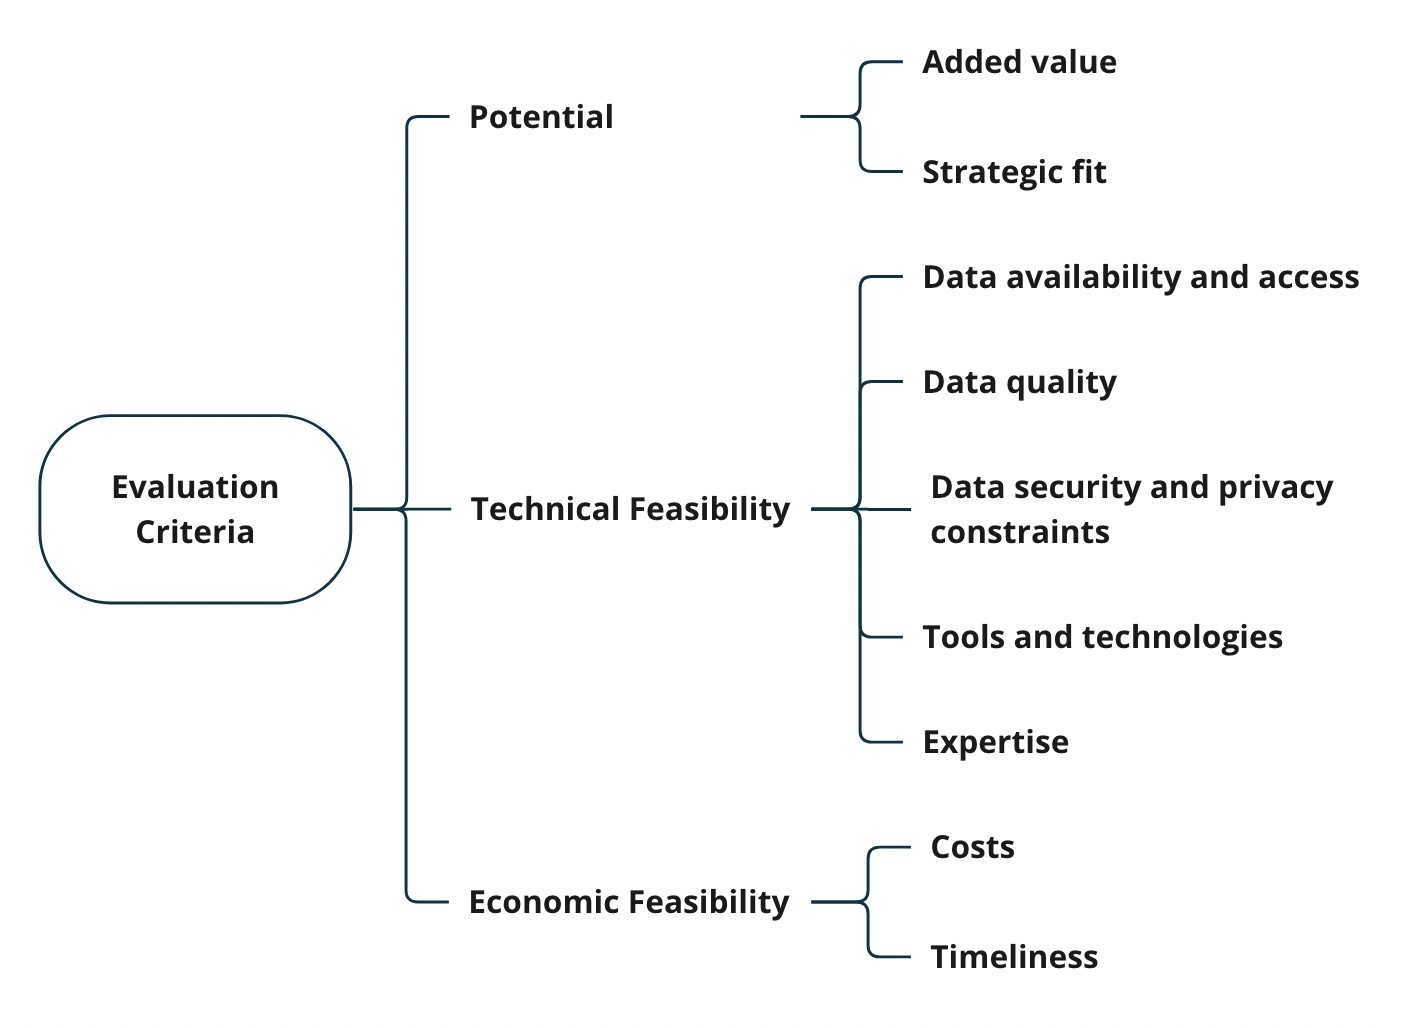
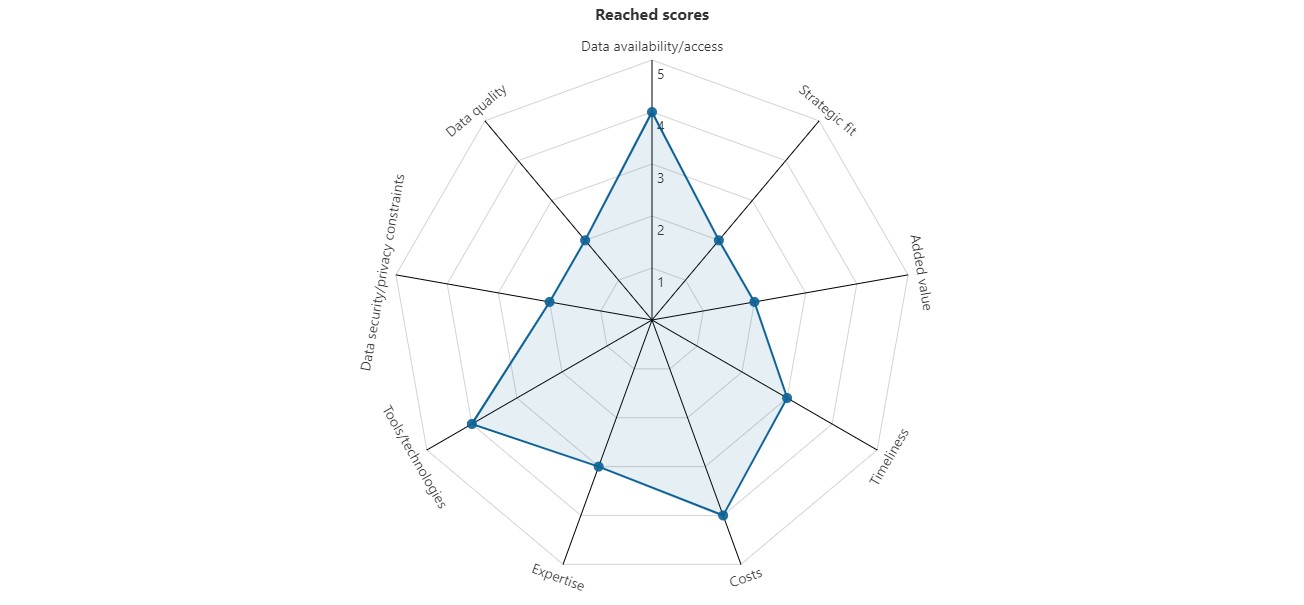
The framework assesses each idea on nine criteria in three dimensions: potential, technical feasibility and economic feasibility.
A one-page template guides teams through a use case description (problem, solution, users, KPIs), the evaluation with guiding questions for each criterion (What data is needed, and is it already available? What is the sensitivity level of the data? Who has the required skills?) and a summary with stakeholders, risks and a recommendation.
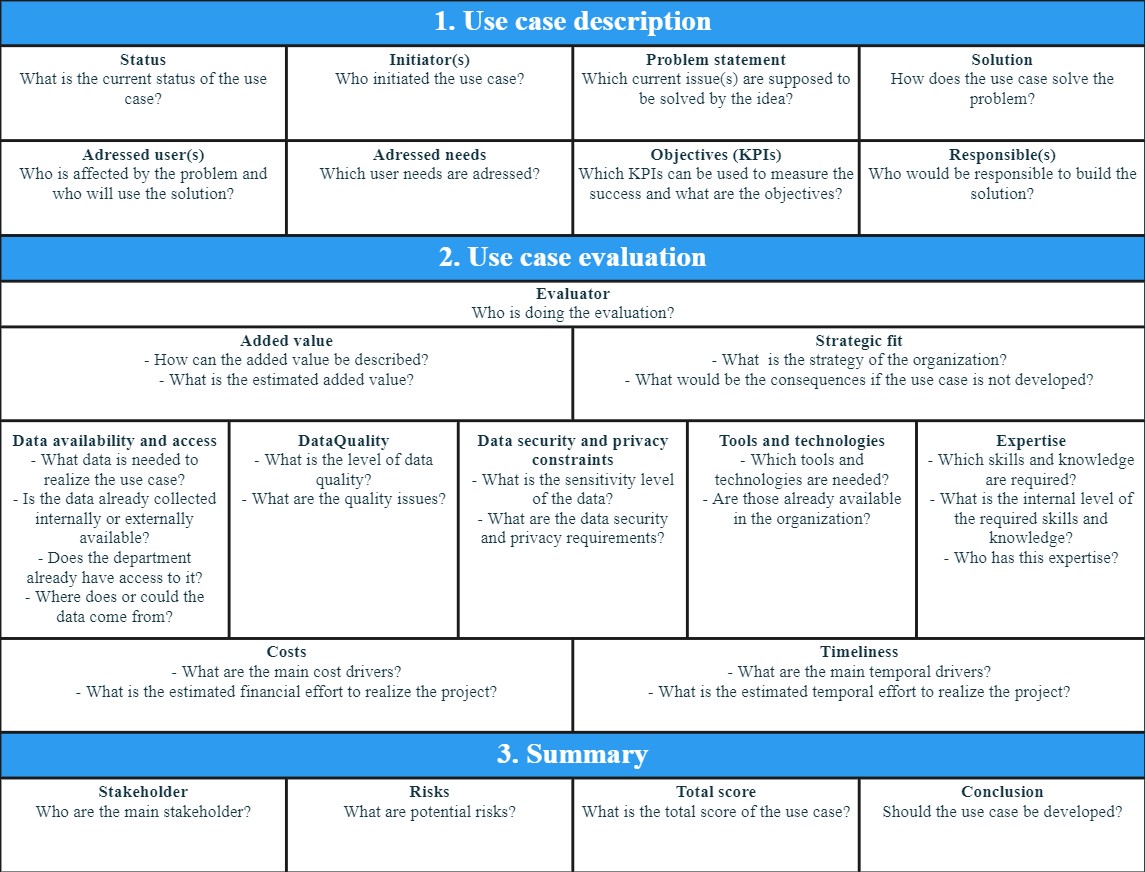
Each criterion is scored from 1 to 5 points; weights can be added and criteria exchanged. Based on the total score, a use case is rejected, revised or accepted, and a radar chart shows its strengths and weaknesses at a glance. Rejected ideas go into an idea pool and can be re-evaluated when the required data, technologies or expertise become available.
The framework complements the ideation tools above: first generate data ideas with the Data Innovation Board, then screen them systematically.
Data literacy
Data-driven innovation depends on people who can work with data. Just as literacy describes the ability to read and write, data literacy is the ability to work with data critically and productively: to analyse data, draw conclusions from it, communicate these conclusions and critically evaluate the data-based conclusions of others. Which competences does it comprise, which levels exist, and how can they be measured for individuals and organisations?
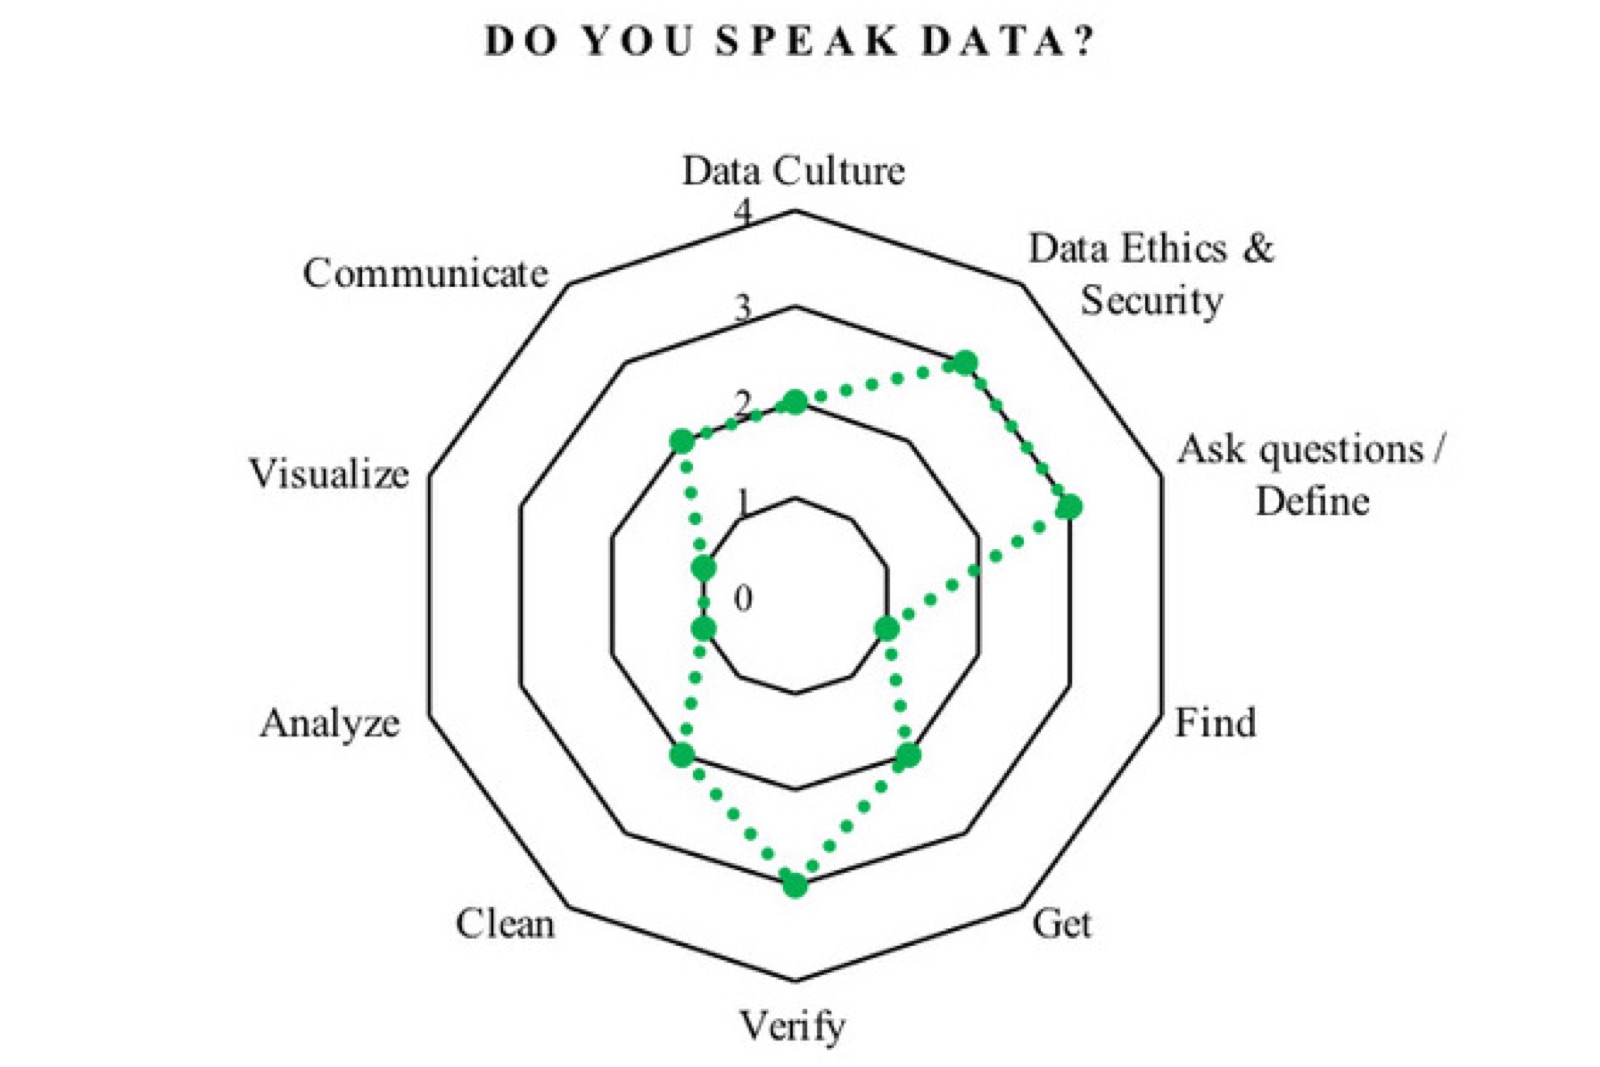
Together with Helena Sternkopf, I developed a maturity model for data literacy in non-governmental organisations (HICSS 2018). Starting from a structured literature review, the model was refined over several iterations with action design research, with the Datenschule of the Open Knowledge Foundation Germany and a further NGO as cases. Expert interviews and test feedback led to a model with eleven competence areas on four levels, a maturity grid and a self-assessment tool. Follow-up work examined the data literacy of brand managers (ICB 2019).
In teaching
The methods are an integral part of my courses, from Digital Business Models in the bachelor’s programme to the master’s programme Business Intelligence & Process Management, where student teams develop data-driven products with industry partners. They build on earlier work on Lean Design Thinking. The question of how people judge data-driven results critically is also central to my teaching, from statistics to AI-audited statistics.
- Kronsbein & Mueller (2019): Data Thinking: A Canvas for Data-Driven Ideation Workshops. HICSS 2019
- Sternkopf & Mueller (2018): Doing Good with Data: Development of a Maturity Model for Data Literacy in Non-governmental Organizations. HICSS 2018
- Lecuna, Thoring & Mueller (2019): The Idea Arc: Designing a Visual Canvas for Fuzzy Ideas. HICSS 2019
- Kayser, Mueller & Kronsbein (2019): Data Collection Map: A Canvas for Shared Data Awareness in Data-Driven Innovation Projects. Pre-ICIS SIGDSA Symposium
- Kayser, Fruhwirth & Mueller (2021): Realizing Value with Data and Analytics: Classification Approaches of Data-Driven Innovations. HICSS 2021
- Schwarz, List & Mueller (2023): A Framework for the Systematic Evaluation of Data and Analytics Use Cases at an Early Stage. HICSS 2023